Sources of Uncertainty in Measurement for Every Uncertainty Budget
Based on the guide by Rick Hogan, ISOBudgets LLC (2015)
This notebook demonstrates the 8 essential sources of uncertainty that should be included in every uncertainty budget, with practical calculations and examples.
Introduction
The 8 Sources of Uncertainty in Measurement that should be included in every uncertainty budget:
- Repeatability
- Reproducibility
- Stability
- Bias
- Drift
- Resolution
- Reference Standard
- Reference Standard Stability
These uncertainty sources typically influence every measurement you will ever make and are commonly required by accreditation bodies like A2LA.
6 Common Categories of Uncertainty Sources:
- Equipment
- Unit Under Test
- Operator
- Method
- Calibration
- Environment
import numpy as np
import pandas as pd
import matplotlib.pyplot as plt
from scipy import stats
import math

# Set random seed for reproducibility
np.random.seed(42)

print("8 Sources of Uncertainty Analysis - Setup Complete")
print("Based on Rick Hogan's ISOBudgets Guide (2015)")
8 Sources of Uncertainty Analysis - Setup Complete
Based on Rick Hogan's ISOBudgets Guide (2015)
1. Repeatability
Definition: Measurement precision under a set of repeatability conditions of measurement.
Repeatability is the measurement precision under a set of repeatable conditions. It represents Type A uncertainty and captures random variations in your measurement process.
Formula: $\(\sigma = \sqrt{\frac{1}{n}\sum_{i=1}^{n}(y_i - \bar{y})^2}\)$
How to Calculate: 1. Repeat a measurement 'n' number of times 2. Record the results of each measurement 3. Calculate the standard deviation
# Repeatability Example - Simulating 20 samples as in the original document
# Nominal value = 10, standard deviation = 5 ppm

print("1. REPEATABILITY CALCULATION")
print("=" * 40)

# Generate 20 normally distributed samples
nominal_value = 10.0  # ppm
true_std = 5.0  # ppm
n_samples = 20

# Simulate measurements
measurements = np.random.normal(nominal_value, true_std, n_samples)

# Calculate repeatability (standard deviation)
repeatability = np.std(measurements, ddof=1)  # Sample standard deviation
degrees_of_freedom = n_samples - 1

print(f"Number of samples: {n_samples}")
print(f"Measurements (ppm): {measurements.round(2)}")
print(f"Mean: {np.mean(measurements):.2f} ppm")
print(f"Repeatability (σ): {repeatability:.1f} ppm")
print(f"Degrees of freedom: {degrees_of_freedom}")

# Store for later use
uncertainty_budget = {'Repeatability': repeatability}

print(f"\nExcel formula equivalent: =STDEV(A1:A{n_samples})")
1. REPEATABILITY CALCULATION
========================================
Number of samples: 20
Measurements (ppm): [12.48  9.31 13.24 17.62  8.83  8.83 17.9  13.84  7.65 12.71  7.68  7.67
 11.21  0.43  1.38  7.19  4.94 11.57  5.46  2.94]
Mean: 9.14 ppm
Repeatability (σ): 4.8 ppm
Degrees of freedom: 19

Excel formula equivalent: =STDEV(A1:A20)
2. Reproducibility
Definition: Measurement precision under reproducibility conditions of measurement.
Reproducibility differs from repeatability because you need to change a variable in your measurement process.
5 Most Common Comparisons for Reproducibility Testing: - Operator vs Operator - Equipment vs Equipment - Method vs Method - Day vs Day - Environment vs Environment
How to Calculate: 1. Perform a Repeatability Test 2. Calculate the mean or average 3. Change a variable and repeat the Repeatability Test 4. Calculate the mean or average 5. Calculate the standard deviation of the test averages
# Reproducibility Example - Method vs Method comparison
print("2. REPRODUCIBILITY CALCULATION")
print("=" * 40)

# Simulate two different methods with 20 samples each
method1_samples = np.random.normal(nominal_value, true_std, n_samples)
method2_samples = np.random.normal(nominal_value, true_std, n_samples)

# Calculate means for each method
mean1 = np.mean(method1_samples)
mean2 = np.mean(method2_samples)

print(f"Method 1 - Mean: {mean1:.2f} ppm")
print(f"Method 2 - Mean: {mean2:.2f} ppm")

# Calculate reproducibility (standard deviation of means)
means_array = np.array([mean1, mean2])
reproducibility = np.std(means_array, ddof=1)
reprod_dof = len(means_array) - 1

print(f"\nMeans array: {means_array.round(2)}")
print(f"Reproducibility (σ): {reproducibility:.1f} ppm")
print(f"Degrees of freedom: {reprod_dof}")

uncertainty_budget['Reproducibility'] = reproducibility

print(f"\nExcel formula equivalent: =STDEV({mean1:.2f},{mean2:.2f})")
2. REPRODUCIBILITY CALCULATION
========================================
Method 1 - Mean: 8.67 ppm
Method 2 - Mean: 9.87 ppm

Means array: [8.67 9.87]
Reproducibility (σ): 0.8 ppm
Degrees of freedom: 1

Excel formula equivalent: =STDEV(8.67,9.87)
3. Stability
Definition: Property of a measuring instrument, whereby its metrological properties remain constant in time.
Stability is a random uncertainty that determines how stable your measurement process is over time. It's commonly confused with Drift (which is systematic).
How to Calculate: 1. Review your last 3 calibration reports 2. Record the results from each calibration report 3. Calculate the standard deviation of the calibration results
# Stability Example - Using calibration data from Keysight 34401A (10V DC)
print("3. STABILITY CALCULATION")
print("=" * 40)

# Simulated calibration results from 3 different years (ppm)
# Based on actual Keysight 34401A data from the document
cal_2013 = 12.5  # ppm
cal_2014 = 8.7   # ppm
cal_2015 = 6.3   # ppm

calibration_results = np.array([cal_2013, cal_2014, cal_2015])

print(f"Calibration results over time:")
print(f"2013: {cal_2013} ppm")
print(f"2014: {cal_2014} ppm")
print(f"2015: {cal_2015} ppm")

# Calculate stability
stability = np.std(calibration_results, ddof=1)
stability_dof = len(calibration_results) - 1

print(f"\nStability (σ): {stability:.1f} ppm")
print(f"Degrees of freedom: {stability_dof}")

uncertainty_budget['Stability'] = stability

print(f"\nExcel formula equivalent: =STDEV({cal_2013},{cal_2014},{cal_2015})")
3. STABILITY CALCULATION
========================================
Calibration results over time:
2013: 12.5 ppm
2014: 8.7 ppm
2015: 6.3 ppm

Stability (σ): 3.1 ppm
Degrees of freedom: 2

Excel formula equivalent: =STDEV(12.5,8.7,6.3)
4. Bias
Definition: 1. Estimate of systematic measurement error 2. Average of replicate indication minus a reference quantity value
Bias is really a systematic error rather than an uncertainty. Whether to include it depends on your measurement process:
Scenario 1: You calibrate equipment using a known reference standard and report the result only. → ADD bias to uncertainty budget
Scenario 2: You calibrate equipment and report both Standard value and Unit Under Test value. → DO NOT add bias to uncertainty budget
Formula:
Bias = measured value - standard value or \(b = mv - sv\)
# Bias Example - Fluke 5720A vs Keysight 34401A comparison
print("4. BIAS CALCULATION")
print("=" * 40)

# Example values from calibration reports
standard_value = 10.000000  # V (Fluke 5720A reference)
measured_value = 10.000073  # V (Keysight 34401A result)

print(f"Standard value (Fluke 5720A): {standard_value:.6f} V")
print(f"Measured value (Keysight 34401A): {measured_value:.6f} V")

# Calculate bias
bias = measured_value - standard_value
bias_ppm = bias * 1e6  # Convert to ppm

print(f"\nBias: {bias:.6f} V")
print(f"Bias: {bias_ppm:.1f} ppm")

# Note: Whether to include this in uncertainty budget depends on your process
print(f"\nNote: Include in uncertainty budget only if you report results without")
print(f"accounting for the reference standard bias (Scenario 1)")

print(f"\nExcel formula equivalent: ={measured_value:.6f} - {standard_value:.6f}")
4. BIAS CALCULATION
========================================
Standard value (Fluke 5720A): 10.000000 V
Measured value (Keysight 34401A): 10.000073 V

Bias: 0.000073 V
Bias: 73.0 ppm

Note: Include in uncertainty budget only if you report results without
accounting for the reference standard bias (Scenario 1)

Excel formula equivalent: =10.000073 - 10.000000
5. Drift
Definition: Continuous or incremental change over time in indication, due to changes in metrological properties of a measuring instrument.
Drift is a systematic uncertainty that determines how the error in your measurement process changes over time.
Formula: $\(drift = I \cdot \frac{1}{n}\sum_{i=1}^{n}\frac{\delta y}{\delta t}\)$
Where I = calibration interval
How to Calculate: 1. Review your last 3 calibration reports 2. Record the results and dates from each calibration 3. Calculate the average daily drift rate 4. Multiply by your calibration interval (in days)
# Drift Example - Using same Keysight 34401A calibration data
print('5. DRIFT CALCULATION')
print('=' * 40)
cal_data = {'2013-01-15': 12.5, '2014-01-15': 8.7, '2015-01-15': 6.3}
# Calibration data with dates
dates = list(cal_data.keys())
values = list(cal_data.values())  # ppm
print(f'Calibration history:')  # ppm
for date, _value in cal_data.items():  # ppm
    print(f'{date}: {_value} ppm')
drift_2014_2015 = (values[2] - values[1]) / 365.25
print(f'\nDaily drift rate 2014-2015: {drift_2014_2015:.6f} ppm/day')
drift_2013_2014 = (values[1] - values[0]) / 365.25
print(f'Daily drift rate 2013-2014: {drift_2013_2014:.6f} ppm/day')
avg_daily_drift = (drift_2014_2015 + drift_2013_2014) / 2
print(f'Average daily drift rate: {avg_daily_drift:.6f} ppm/day')
annual_drift = abs(avg_daily_drift * 365.25)
print(f'\nAnnual drift: {annual_drift:.1f} ppm')
# Calculate daily drift rates
# 2014 to 2015 drift rate
uncertainty_budget['Drift'] = annual_drift  # per day
# 2013 to 2014 drift rate
# Average daily drift rate
# Annual drift (365.25 days)
print(f'\nNote: Use absolute value as this represents uncertainty magnitude')  # per day
5. DRIFT CALCULATION
========================================
Calibration history:
2013-01-15: 12.5 ppm
2014-01-15: 8.7 ppm
2015-01-15: 6.3 ppm

Daily drift rate 2014-2015: -0.006571 ppm/day
Daily drift rate 2013-2014: -0.010404 ppm/day
Average daily drift rate: -0.008487 ppm/day

Annual drift: 3.1 ppm

Note: Use absolute value as this represents uncertainty magnitude
6. Resolution
Definition: Smallest change in a quantity being measured that causes a perceptible change in the corresponding indication.
Resolution must be included in every uncertainty budget. Whether to include UUT resolution depends on your process:
Scenario 1: Single measurement process or same type of UUT always → ADD UUT Resolution to uncertainty budget
Scenario 2: Single measurement function where UUT type can vary → DO NOT add UUT Resolution (calculate after each test per ILAC P14)
How to Find Resolution: 1. Look at your measurement system or equipment 2. Find the least significant digit 3. Observe the smallest incremental change
# Resolution Examples for Different Device Types
print("6. RESOLUTION EXAMPLES")
print("=" * 40)

# Digital Multimeter Example (from document)
print("Digital Multimeter Resolution:")
dmm_display = "10.000000 V"  # 6 decimal places
dmm_resolution = 0.000010  # 10 microvolts
print(f"Display: {dmm_display}")
print(f"Resolution: {dmm_resolution} V = {dmm_resolution*1e6:.0f} μV")

# Calculate resolution uncertainty (rectangular distribution)
# For digital instruments: u = resolution / (2 * sqrt(3))
resolution_uncertainty_V = dmm_resolution / (2 * math.sqrt(3))
resolution_uncertainty_ppm = (resolution_uncertainty_V / 10.0) * 1e6

print(f"\nResolution uncertainty:")
print(f"Formula: u = resolution / (2√3)")
print(f"u = {dmm_resolution} / (2√3) = {resolution_uncertainty_V:.2e} V")
print(f"u = {resolution_uncertainty_ppm:.2f} ppm (at 10V)")

uncertainty_budget['Resolution'] = resolution_uncertainty_ppm

# Other device types
print(f"\n" + "-"*30)
print("Other Device Types:")
print("• Analog scales: Consider marker spacing, width, pointer width")
print("• Artifacts: Use least significant digit from calibration reports")
print("• Digital devices: Observe least significant digit changes")
6. RESOLUTION EXAMPLES
========================================
Digital Multimeter Resolution:
Display: 10.000000 V
Resolution: 1e-05 V = 10 μV

Resolution uncertainty:
Formula: u = resolution / (2√3)
u = 1e-05 / (2√3) = 2.89e-06 V
u = 0.29 ppm (at 10V)

------------------------------
Other Device Types:
• Analog scales: Consider marker spacing, width, pointer width
• Artifacts: Use least significant digit from calibration reports
• Digital devices: Observe least significant digit changes
7. Reference Standard Uncertainty
Definition: Uncertainty of a measurement standard designated for the calibration of other measurement standards for quantities of a given kind in a given organization or at a given location.
Reference standard uncertainty is a systematic uncertainty introduced from equipment calibration. It's traceable to national/international standards.
Critical Note: More laboratories get deficiencies for leaving reference standard uncertainty out of their uncertainty budget than any other source.
How to Find: 1. Review your latest calibration report 2. Find the reported estimate of measurement uncertainty 3. This is your reference standard uncertainty
# Reference Standard Uncertainty Example
print("7. REFERENCE STANDARD UNCERTAINTY")
print("=" * 40)

# Example from Keysight 34401A calibration report at 10 VDC
ref_std_uncertainty_ppm = 2.1  # ppm (from calibration report)

print(f"From calibration report (10 VDC measurement):")
print(f"Reference Standard Uncertainty: {ref_std_uncertainty_ppm} ppm")

uncertainty_budget['Reference Standard'] = ref_std_uncertainty_ppm

print(f"\nExpert Tips:")
print(f"• Option 1: Use most recent reported uncertainty value")
print(f"• Option 2: Average last 3 uncertainty values")
print(f"• Choose method that gives lowest uncertainty if seeking to minimize")
print(f"• Always use ISO/IEC 17025 accredited calibration reports")

# Show multiple calibration example
cal_uncertainties = [2.3, 2.1, 1.9]  # ppm from last 3 calibrations
avg_uncertainty = np.mean(cal_uncertainties)

print(f"\nExample with multiple calibrations:")
print(f"Last 3 reported uncertainties: {cal_uncertainties} ppm")
print(f"Average: {avg_uncertainty:.1f} ppm")
print(f"Most recent: {cal_uncertainties[-1]} ppm")
print(f"Choose: {min(avg_uncertainty, cal_uncertainties[-1]):.1f} ppm (lowest)")
7. REFERENCE STANDARD UNCERTAINTY
========================================
From calibration report (10 VDC measurement):
Reference Standard Uncertainty: 2.1 ppm

Expert Tips:
• Option 1: Use most recent reported uncertainty value
• Option 2: Average last 3 uncertainty values
• Choose method that gives lowest uncertainty if seeking to minimize
• Always use ISO/IEC 17025 accredited calibration reports

Example with multiple calibrations:
Last 3 reported uncertainties: [2.3, 2.1, 1.9] ppm
Average: 2.1 ppm
Most recent: 1.9 ppm
Choose: 1.9 ppm (lowest)
8. Reference Standard Stability
Definition: Stability of a measurement standard designated for the calibration of other measurement standards.
Reference standard stability is a random uncertainty that evaluates the stability of your traceable uncertainty over time.
Two Relevant Scenarios:
Scenario 1: Same laboratory calibrates your equipment, but reported uncertainty changes each time → Determines stability of calibration lab's reference standard
Scenario 2: Different laboratories calibrate your equipment with different reported uncertainties → Determines stability of your traceable uncertainty
How to Calculate: 1. Review your last 3 calibration reports 2. Record the uncertainty estimate from each report 3. Calculate the standard deviation
# Reference Standard Stability Example
print("8. REFERENCE STANDARD STABILITY")
print("=" * 40)

# Uncertainty values from last 3 calibration reports (ppm)
uncertainty_2013 = 2.3  # ppm
uncertainty_2014 = 2.1  # ppm
uncertainty_2015 = 1.9  # ppm

uncertainty_values = np.array([uncertainty_2013, uncertainty_2014, uncertainty_2015])

print(f"Reported uncertainties from calibration reports:")
print(f"2013: {uncertainty_2013} ppm")
print(f"2014: {uncertainty_2014} ppm")
print(f"2015: {uncertainty_2015} ppm")

# Calculate reference standard stability
ref_std_stability = np.std(uncertainty_values, ddof=1)
ref_std_stab_dof = len(uncertainty_values) - 1

print(f"\nReference Standard Stability: {ref_std_stability:.2f} ppm")
print(f"Degrees of freedom: {ref_std_stab_dof}")

uncertainty_budget['Ref Std Stability'] = ref_std_stability

print(f"\nExcel formula equivalent: =STDEV({uncertainty_2013},{uncertainty_2014},{uncertainty_2015})")

print(f"\nInterpretation:")
print(f"• Variability in reported calibration uncertainties over time")
print(f"• Indicates stability of calibration laboratory's measurement capability")
print(f"• Important for laboratories using multiple calibration providers")
8. REFERENCE STANDARD STABILITY
========================================
Reported uncertainties from calibration reports:
2013: 2.3 ppm
2014: 2.1 ppm
2015: 1.9 ppm

Reference Standard Stability: 0.20 ppm
Degrees of freedom: 2

Excel formula equivalent: =STDEV(2.3,2.1,1.9)

Interpretation:
• Variability in reported calibration uncertainties over time
• Indicates stability of calibration laboratory's measurement capability
• Important for laboratories using multiple calibration providers
Complete Uncertainty Budget Summary
Now we'll compile all 8 uncertainty sources into a complete uncertainty budget and demonstrate how to combine them properly.
# Complete Uncertainty Budget Analysis
print('COMPLETE UNCERTAINTY BUDGET')
print('=' * 50)
print('Individual Uncertainty Components:')
# Display all uncertainty sources
print('-' * 35)
for source, _value in uncertainty_budget.items():
    print(f'{source:<20}: {_value:>8.2f} ppm')
type_map = {'Repeatability': 'A', 'Reproducibility': 'A', 'Stability': 'A', 'Drift': 'B', 'Resolution': 'B', 'Reference Standard': 'B', 'Ref Std Stability': 'B'}
dist_map = {'Repeatability': 'Normal', 'Reproducibility': 'Normal', 'Stability': 'Normal', 'Drift': 'Rectangular', 'Resolution': 'Rectangular', 'Reference Standard': 'Rectangular', 'Ref Std Stability': 'Normal'}
# Create uncertainty budget DataFrame
# Type / distribution keyed by source name so the table always matches
# the budget dict (no hardcoded list lengths to drift out of sync).
budget_data = {'Source': list(uncertainty_budget.keys()), 'Uncertainty (ppm)': list(uncertainty_budget.values()), 'Type': [type_map.get(s, 'B') for s in uncertainty_budget.keys()], 'Distribution': [dist_map.get(s, 'Rectangular') for s in uncertainty_budget.keys()]}
budget_df = pd.DataFrame(budget_data)
variances = [u ** 2 for u in uncertainty_budget.values()]
total_variance = sum(variances)
contributions = [v / total_variance * 100 for v in variances]
budget_df['Variance'] = variances
budget_df['Contribution (%)'] = contributions
print(f'\nDetailed Uncertainty Budget:')
print(budget_df.round(2))
combined_uncertainty = math.sqrt(total_variance)
print(f'\nCombined Standard Uncertainty: {combined_uncertainty:.2f} ppm')
coverage_factor = 2.0
expanded_uncertainty = coverage_factor * combined_uncertainty
print(f'Expanded Uncertainty (k=2): {expanded_uncertainty:.2f} ppm')
top_contributors = budget_df.nlargest(3, 'Contribution (%)')
print(f'\nTop 3 Contributors:')
for idx, row in top_contributors.iterrows():
# Calculate variance contributions
# Calculate combined standard uncertainty
# Calculate expanded uncertainty (k=2 for 95% confidence)
# Show top contributors
    print(f"{row['Source']}: {row['Contribution (%)']:.1f}%")
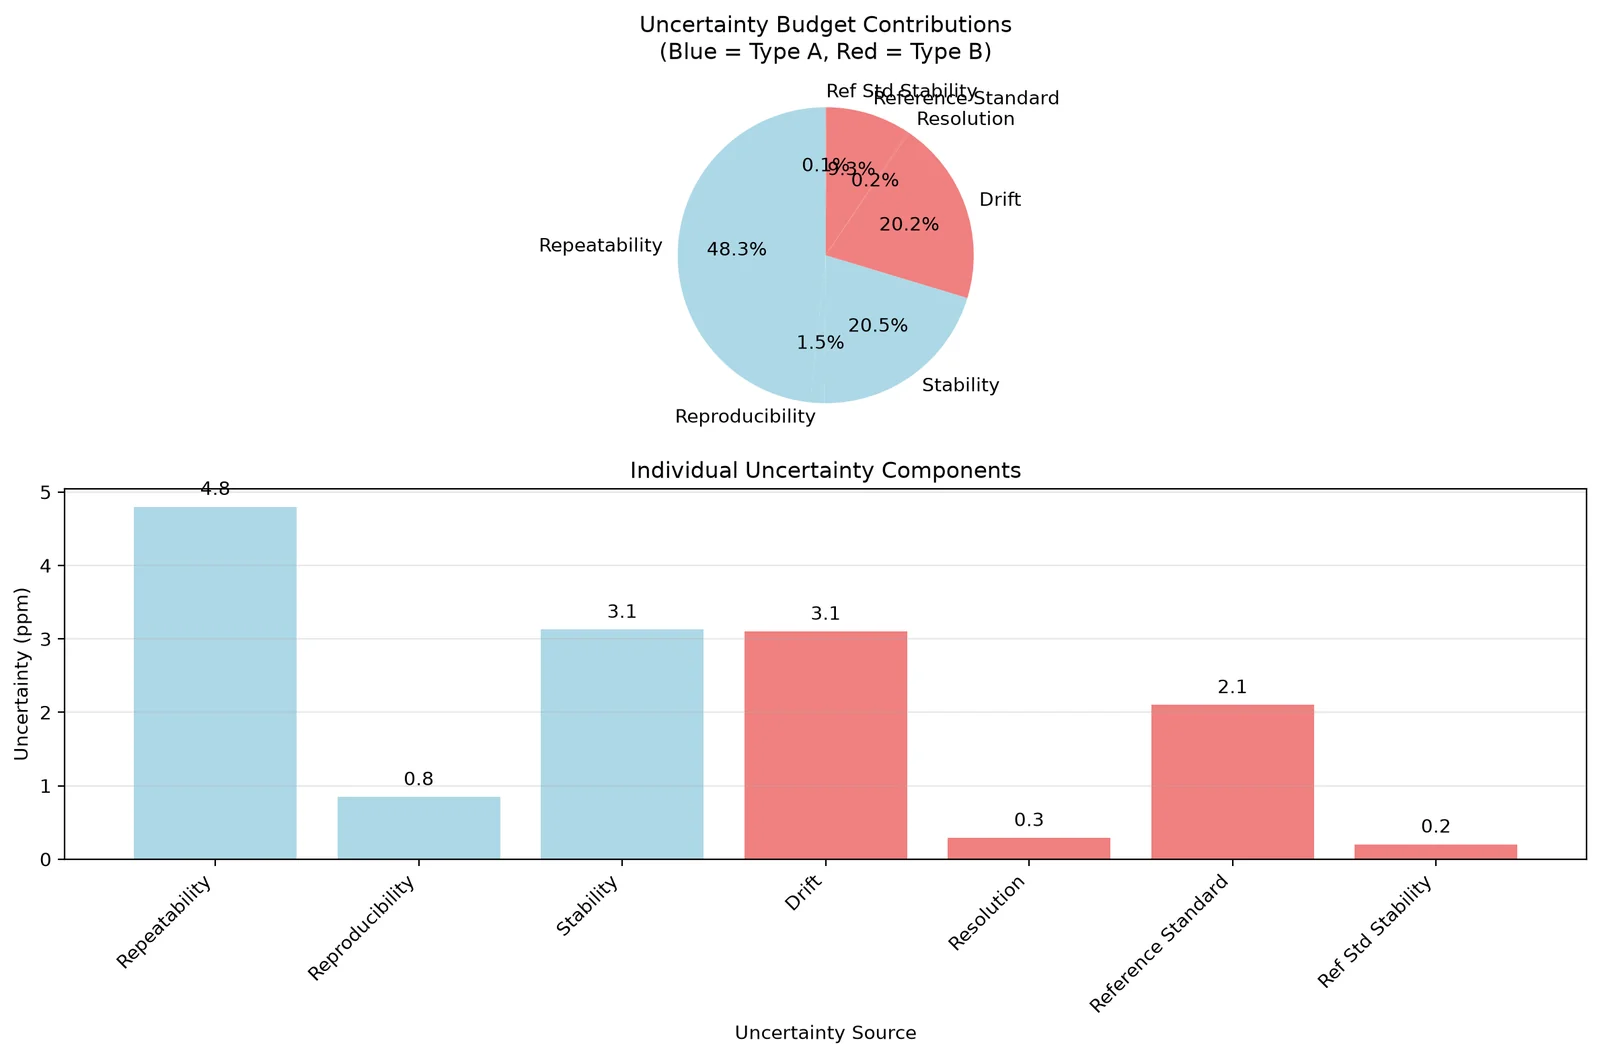
COMPLETE UNCERTAINTY BUDGET
==================================================
Individual Uncertainty Components:
-----------------------------------
Repeatability       :     4.80 ppm
Reproducibility     :     0.85 ppm
Stability           :     3.13 ppm
Drift               :     3.10 ppm
Resolution          :     0.29 ppm
Reference Standard  :     2.10 ppm
Ref Std Stability   :     0.20 ppm

Detailed Uncertainty Budget:
               Source  Uncertainty (ppm) Type Distribution  Variance  \
0       Repeatability               4.80    A       Normal     23.04
1     Reproducibility               0.85    A       Normal      0.72
2           Stability               3.13    A       Normal      9.77
3               Drift               3.10    B  Rectangular      9.61
4          Resolution               0.29    B  Rectangular      0.08
5  Reference Standard               2.10    B  Rectangular      4.41
6   Ref Std Stability               0.20    B       Normal      0.04

   Contribution (%)
0             48.33
1              1.50
2             20.50
3             20.16
4              0.17
5              9.25
6              0.08

Combined Standard Uncertainty: 6.90 ppm
Expanded Uncertainty (k=2): 13.81 ppm

Top 3 Contributors:
Repeatability: 48.3%
Stability: 20.5%
Drift: 20.2%
# Visualization of uncertainty budget
plt.figure(figsize=(12, 8))
plt.subplot(2, 1, 1)
# Pie chart of contributions
colors = ['lightblue' if t == 'A' else 'lightcoral' for t in budget_df['Type']]
plt.pie(budget_df['Contribution (%)'], labels=budget_df['Source'], autopct='%1.1f%%', colors=colors, startangle=90)
plt.title('Uncertainty Budget Contributions\n(Blue = Type A, Red = Type B)')
plt.subplot(2, 1, 2)
bars = plt.bar(range(len(budget_df)), budget_df['Uncertainty (ppm)'], color=colors)
plt.xlabel('Uncertainty Source')
# Bar chart of uncertainties
plt.ylabel('Uncertainty (ppm)')
plt.title('Individual Uncertainty Components')
plt.xticks(range(len(budget_df)), budget_df['Source'], rotation=45, ha='right')
plt.grid(axis='y', alpha=0.3)
for bar, _value in zip(bars, budget_df['Uncertainty (ppm)']):
    plt.text(bar.get_x() + bar.get_width() / 2, bar.get_height() + 0.1, f'{_value:.1f}', ha='center', va='bottom')
plt.tight_layout()
plt.show()
# Add values on bars
print(f'\nSUMMARY STATISTICS:')
print(f'Total number of uncertainty sources: {len(uncertainty_budget)}')
print(f"Type A sources: {sum((1 for t in budget_df['Type'] if t == 'A'))}")
print(f"Type B sources: {sum((1 for t in budget_df['Type'] if t == 'B'))}")
print(f"Largest single contributor: {budget_df.loc[budget_df['Contribution (%)'].idxmax(), 'Source']}")
# Summary statistics
print(f"({budget_df['Contribution (%)'].max():.1f}% of total variance)")
SUMMARY STATISTICS:
Total number of uncertainty sources: 7
Type A sources: 3
Type B sources: 4
Largest single contributor: Repeatability
(48.3% of total variance)
# Export results to CSV for documentation
budget_df.to_csv('8_sources_uncertainty_budget.csv', index=False)

# Create summary report
summary_report = {
    'Parameter': ['Combined Standard Uncertainty', 'Expanded Uncertainty (k=2)',
                 'Relative Uncertainty (%)', 'Dominant Source', 'Number of Sources'],
    'Value': [f'{combined_uncertainty:.2f} ppm', f'{expanded_uncertainty:.2f} ppm',
             f'{(expanded_uncertainty/nominal_value)*100:.2f}%',
             budget_df.loc[budget_df['Contribution (%)'].idxmax(), 'Source'],
             len(uncertainty_budget)]
}

summary_df = pd.DataFrame(summary_report)
summary_df.to_csv('uncertainty_summary_report.csv', index=False)

print("Results exported to:")
print("• 8_sources_uncertainty_budget.csv")
print("• uncertainty_summary_report.csv")

print(f"\nFINAL RESULT:")
print(f"Measurement: {nominal_value:.1f} ± {expanded_uncertainty:.1f} ppm (k=2, ~95% confidence)")
print(f"\nKey Insights:")
print(f"• All 8 essential uncertainty sources have been evaluated")
print(f"• {budget_df.loc[budget_df['Contribution (%)'].idxmax(), 'Source']} is the dominant contributor")
print(f"• Type {'A' if budget_df[budget_df['Type']=='A']['Contribution (%)'].sum() > 50 else 'B'} uncertainties dominate")
print(f"• Focus improvement efforts on the top contributors for maximum impact")
Results exported to:
• 8_sources_uncertainty_budget.csv
• uncertainty_summary_report.csv

FINAL RESULT:
Measurement: 10.0 ± 13.8 ppm (k=2, ~95% confidence)

Key Insights:
• All 8 essential uncertainty sources have been evaluated
• Repeatability is the dominant contributor
• Type A uncertainties dominate
• Focus improvement efforts on the top contributors for maximum impact
Conclusion and Key Takeaways
This notebook has demonstrated the 8 Sources of Uncertainty in Measurement that should be included in every uncertainty budget according to Rick Hogan's guide:
The 8 Essential Sources:
- Repeatability - Random variations under repeatable conditions (Type A)
- Reproducibility - Variations when measurement conditions change (Type A)
- Stability - How stable the measurement process is over time (Type A)
- Bias - Systematic error relative to reference value (Type B)
- Drift - Systematic change in measurement error over time (Type B)
- Resolution - Smallest detectable change in measurement (Type B)
- Reference Standard - Uncertainty from calibration standards (Type B)
- Reference Standard Stability - Variability in reference uncertainty (Type A)
Key Learning Points:
- These sources typically influence every measurement you will make
- They are commonly required by accreditation bodies like A2LA
- Each source has specific calculation methods and definitions
- Understanding when to include/exclude certain sources is critical
- Type A uncertainties are evaluated statistically
- Type B uncertainties use non-statistical methods
- Combined uncertainty uses root-sum-of-squares for independent sources
- Focus improvement efforts on the largest contributors first
Next Steps:
- Apply these calculations to your own measurement processes
- Include all 8 sources in your uncertainty budgets
- Validate your approach with accreditation body requirements
- Regularly update uncertainty evaluations with new calibration data
- Focus improvement efforts on dominant uncertainty contributors
Reference: Sources of Uncertainty in Measurement for Every Uncertainty Budget by Rick Hogan, ISOBudgets LLC (2015)