Calibration of non-linear relations
Non linear relations of \(y = f(x)\)
When we expect $\(y = ax^2 + bx + c\)$, our task is to estimate \(a, b, c\) using the best-fit, i.e that coefficients that give us the smallest error between the the model and the measurements.
In any case, the easiest and most accurate fit is of a linear type - we know that the static sensitivity is our goal and it has a lot of usefuleness in the following measurements. Therefore we always look for the way to convert our non-linear relation to linear one and then perform best-fit or regression on the transformed variables.
import pylab
from pylab import figure, log, log10, loglog, plot, polyfit, xlabel, xlim, ylabel, ylim
pylab.rcParams['figure.figsize'] = 10, 8
pylab.rcParams['font.size'] = 16

# read the data
import numpy as np
x = np.array([0.5, 1.0, 2.0, 5.0, 10.0, 20.0, 50.0, 100.0]) # cm
y = np.array([0.4, 1.0, 2.3, 6.9, 15.8, 36.4, 110.1, 253.2]) # Volt
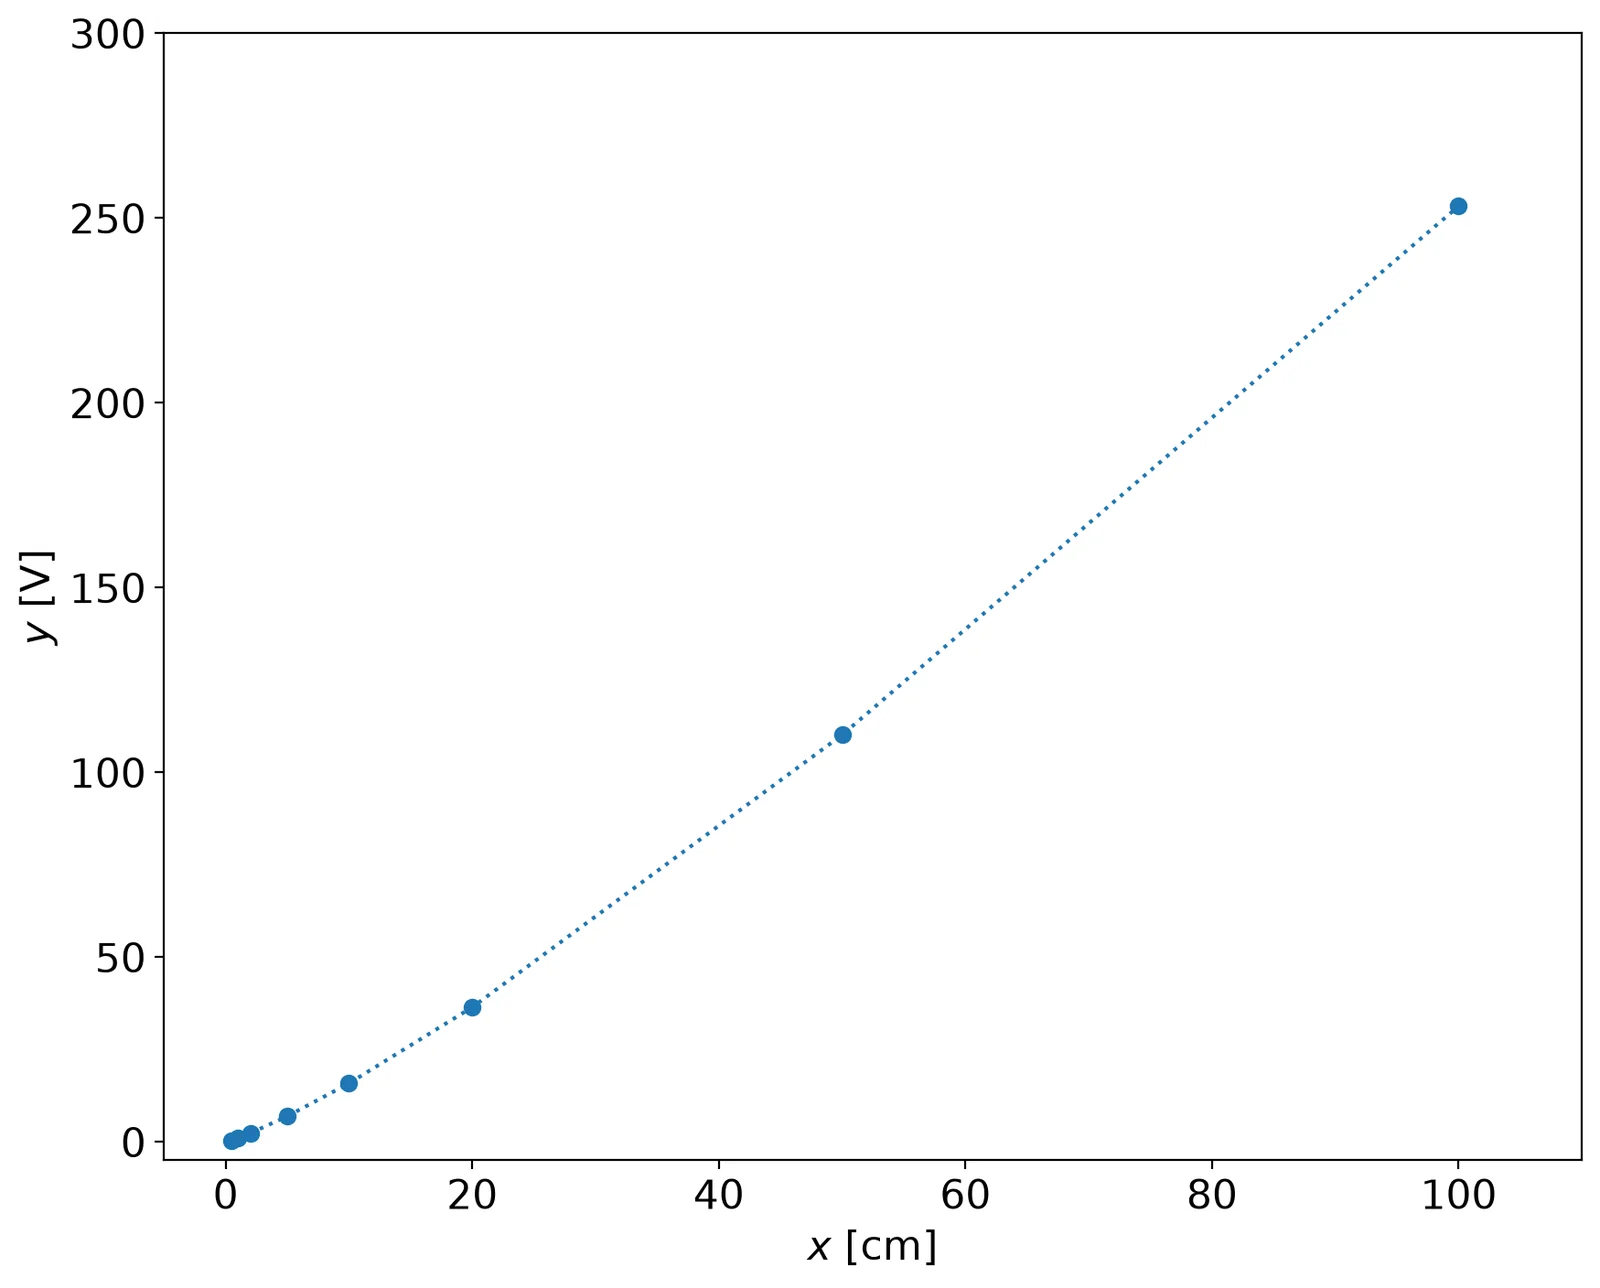
Conclusion:
- Obviously the result is non-linear and the best sensitivity we can get is between 20 and 40 cm, but not for small distances
- If the relationship is a known function and it's a physically relevant one, we could use it to show that distance to voltage should be related as a power law and not really linearly. Let's check the logarithmic scale, since we know that:
$\log y = \log (bx^m) = \log b + m \log x $
_fig = figure()
loglog(x, y, 'o:')
# xlim(-5,110)
# ylim(-5,300)
xlabel('$x$ [cm]')
ylabel('$y$ [V]')
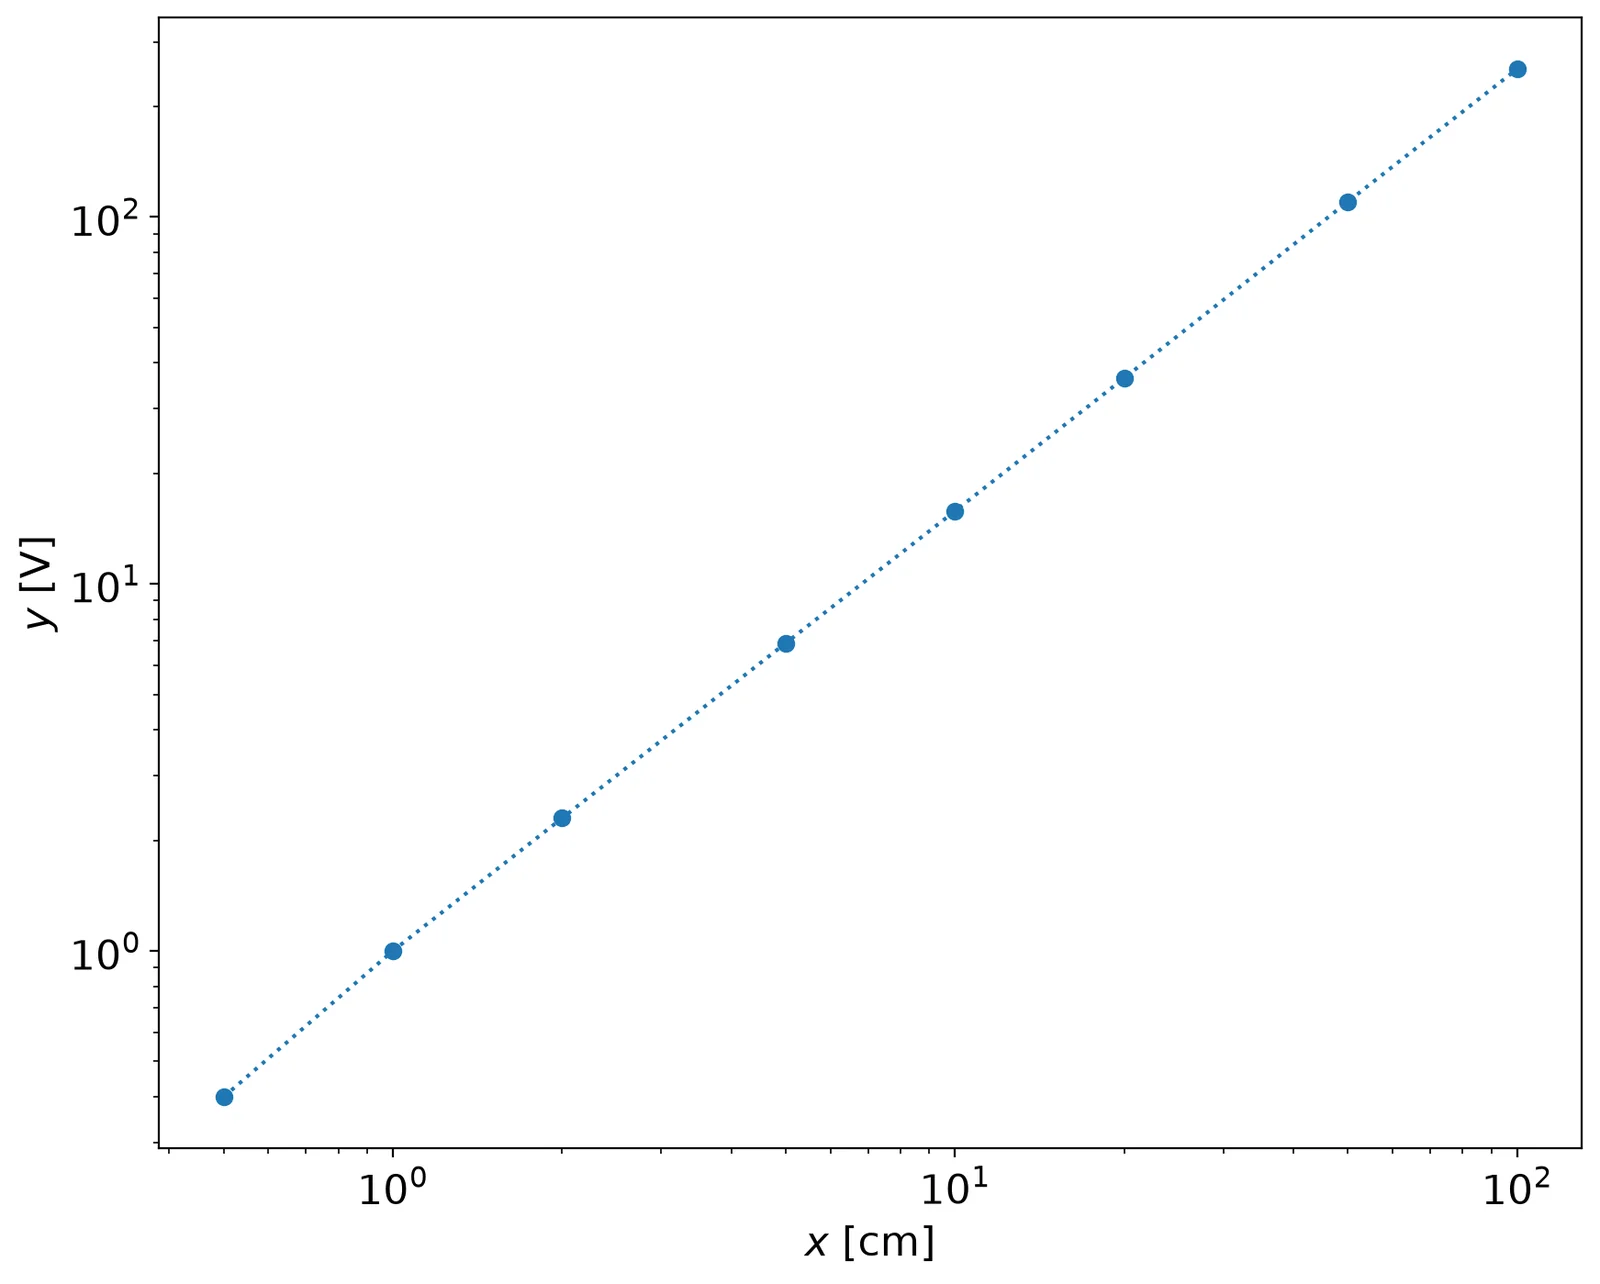
This result shows that the result is close to linear in the log-log space. Let's do calibration in \(\log(x)\) and \(\log(y)\). It can be either \(\log\) or \(\log_{10}\)
_fig = figure()
plot(log(x), log(y), 'o:')
# xlim(-5,110)
# ylim(-5,300)
xlabel('$\\log (x)$ [cm]')
ylabel('$\\log (y) $ [V]')
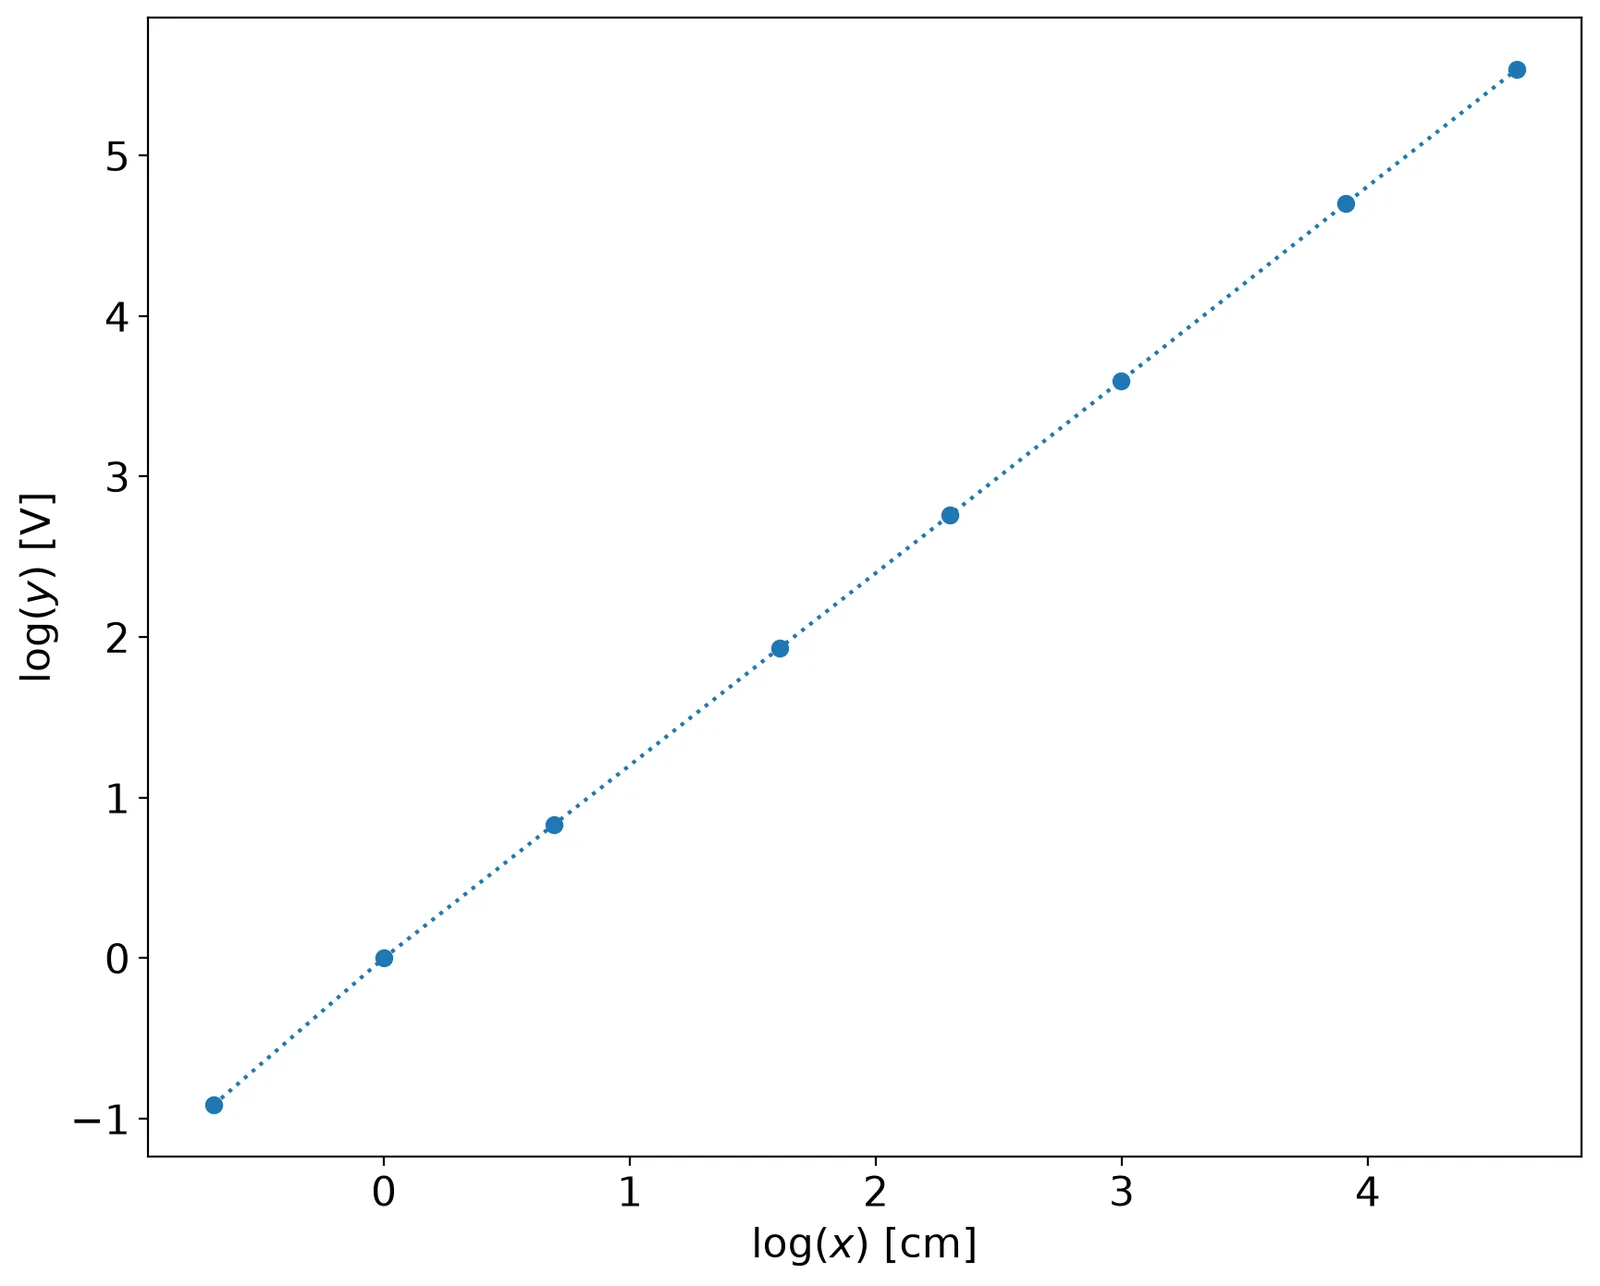
array([ 1.21031575, -0.01252781])
# let's check the fit:
_fig = figure()
yfit = 10 ** (p[0] * log10(x) + p[1])
plot(x, y, 'o:', x, yfit, 'rs--')
xlim(-5, 110)
ylim(-5, 300)
xlabel('$x$ [cm]')
ylabel('$y$ [V]')
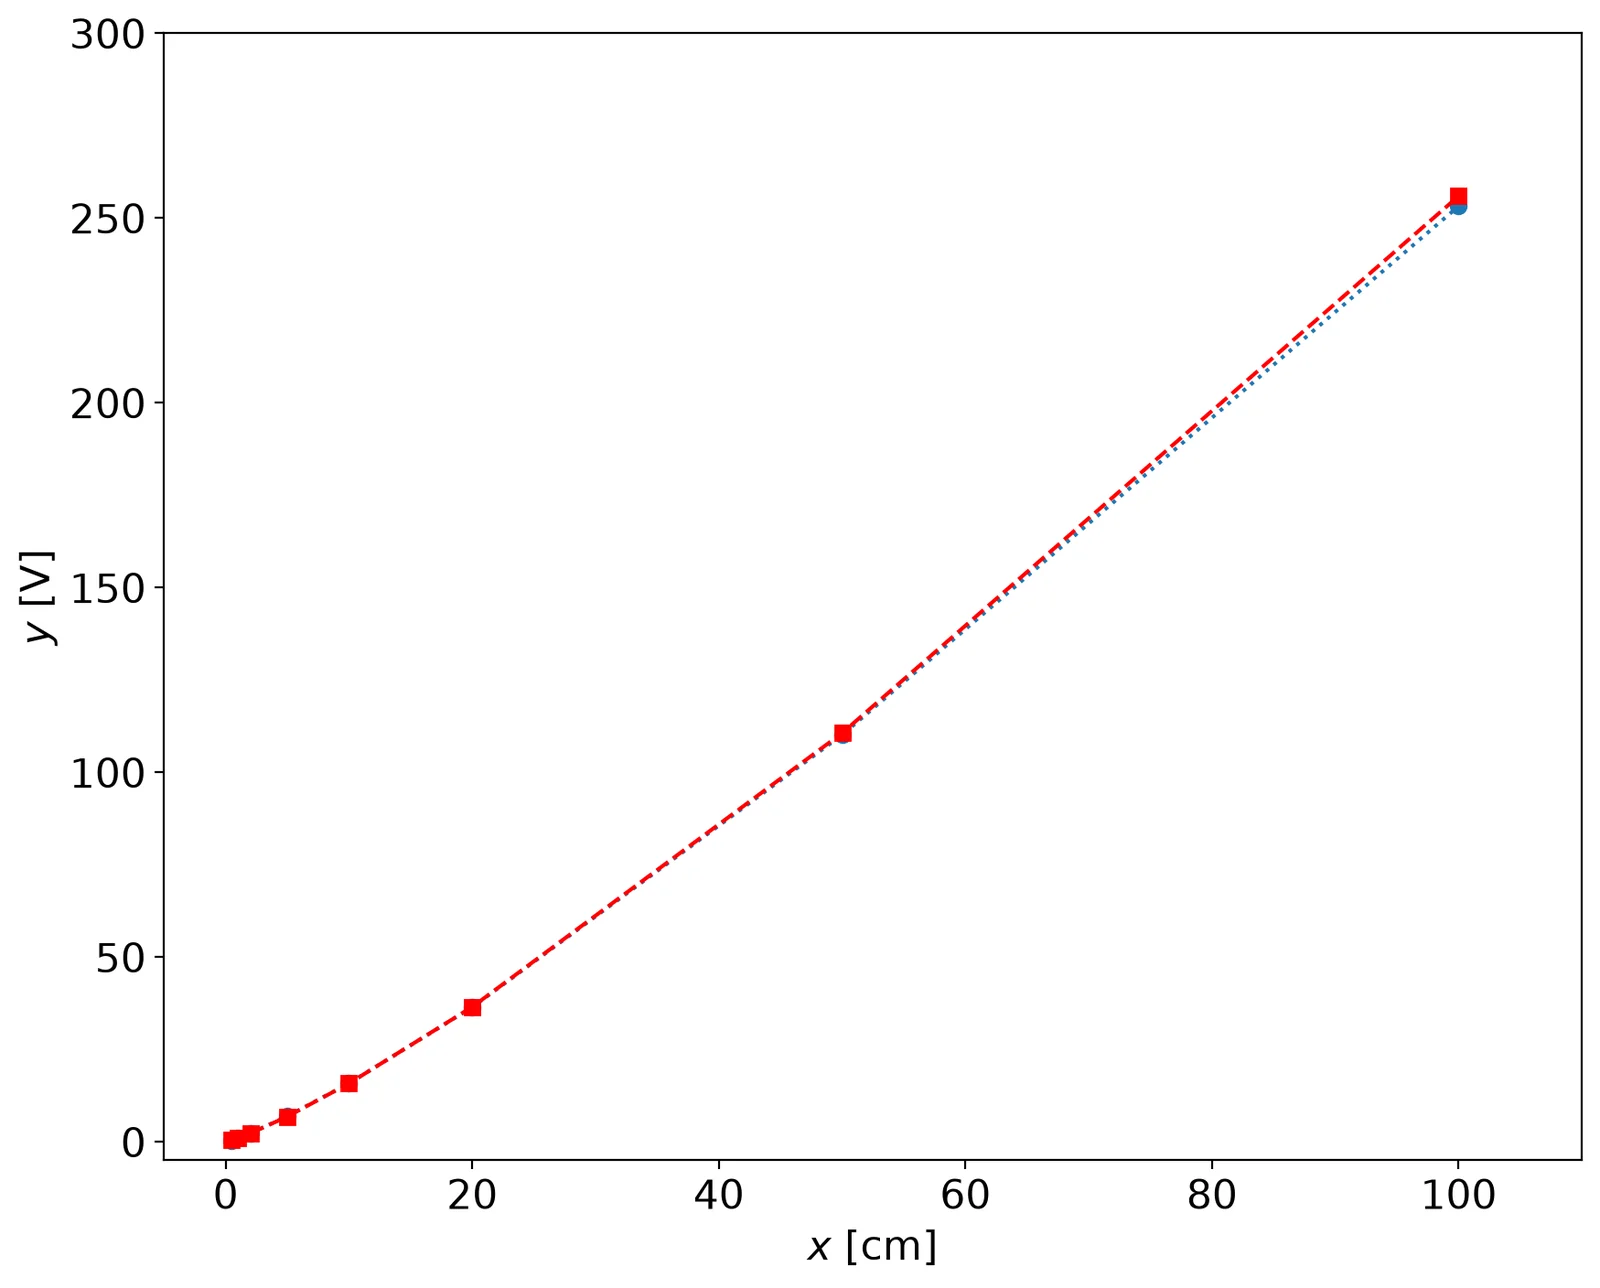
how do we measure?
- measure the \(y\) [V], take a \(\log_{10}(y)\), estimate the $\log_{10}(x) $ using the calibration curve:
$ \log_{10}(x) = (\log_{10}(y) + 0.0125)/1.21 $
- Note that we can use this function in the full input scale and full output scale, take:
\(10^{\log_{10} (x)}\)
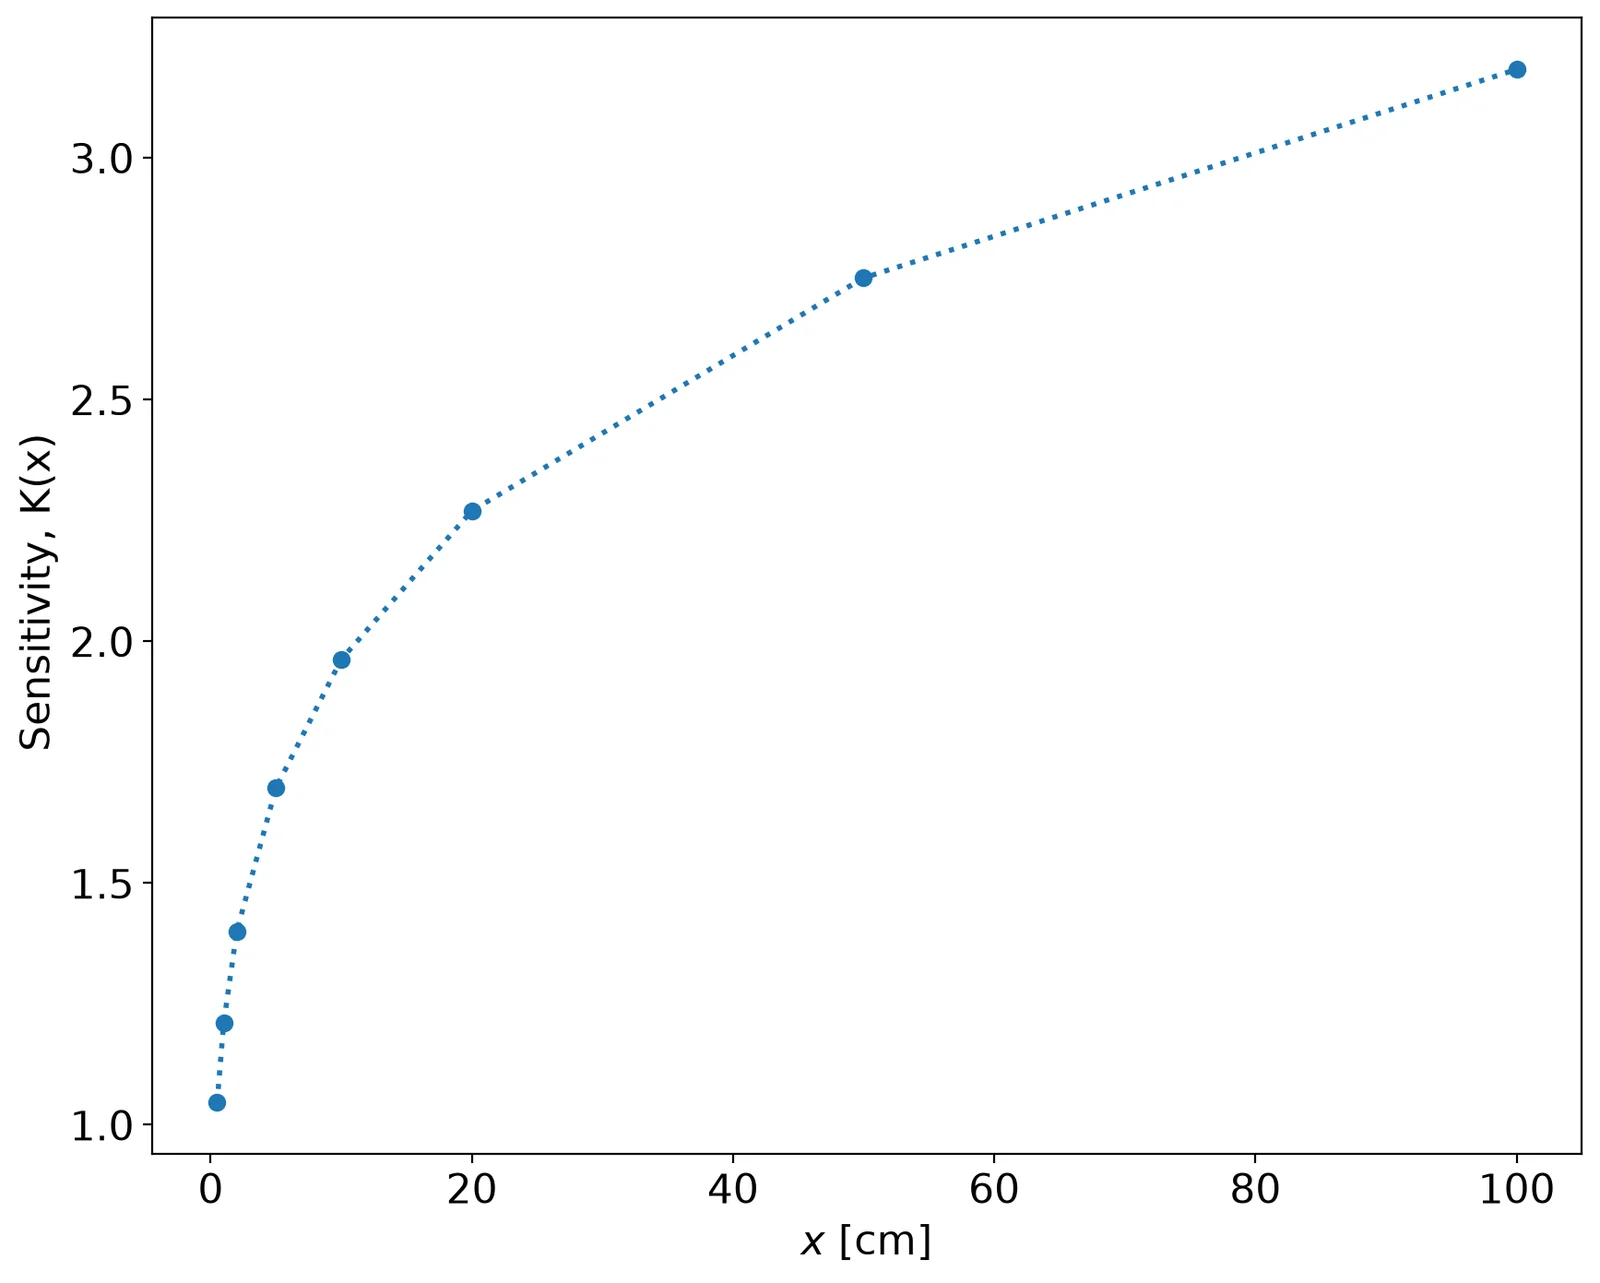
- The sensitivity of this function is:
$K(x) = dy/dx = d/dx ( x^{1.2} ) = 1.2 x^{0.2} $
_fig = figure()
K = 1.21 * x ** 0.21
plot(x, K, 'o:', lw=2)
xlabel('$x$ [cm]')
ylabel('Sensitivity, K(x) ')