GUM Budgets: Orifice Flow Meter and Storage Tank
Static Calibration Errors: Engineering Testing & Measurements
This notebook demonstrates the application of the Guide to the Expression of Uncertainty in Measurement (GUM) framework for static calibration errors in two examples: an Orifice Flow Meter and a Cylindrical Storage Tank.
GUM Budgets: Orifice Flow Meter and Storage Tank
 |
 |
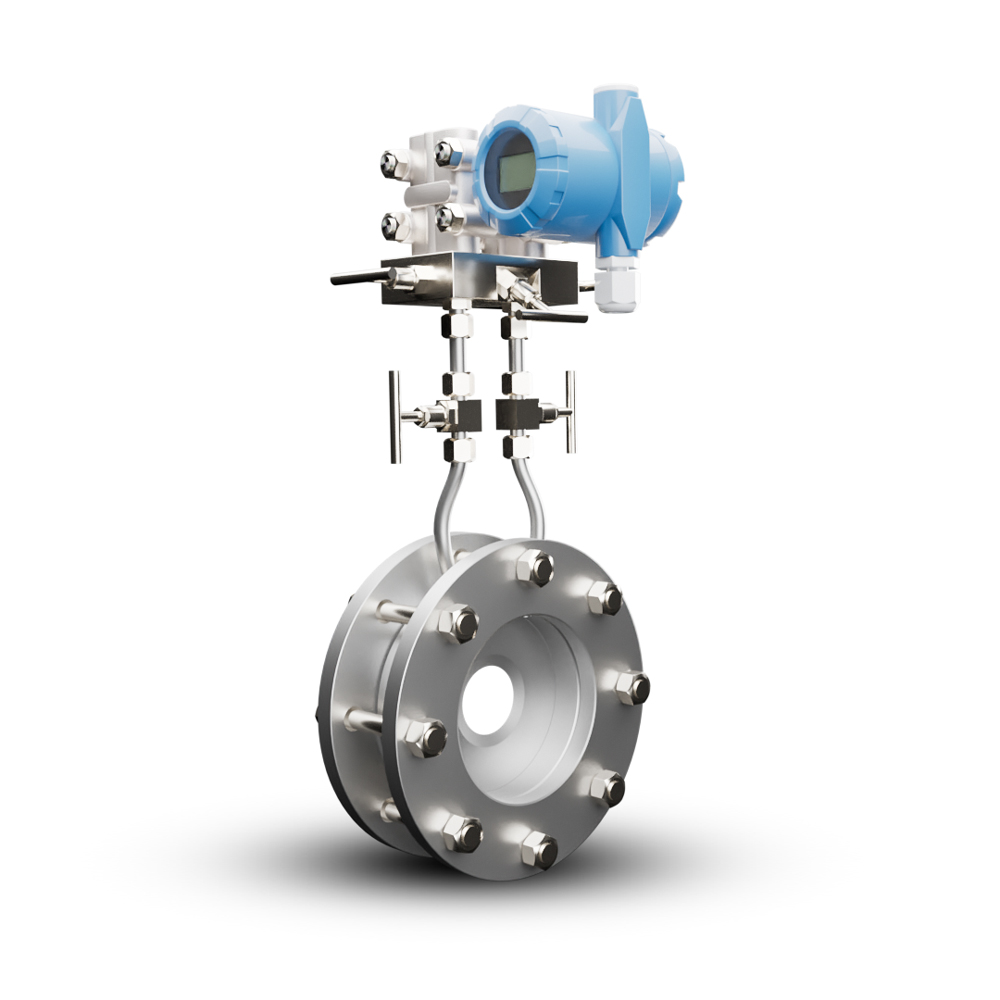
Part 1: Calibration Example: Orifice Flow Meter
1.1 Orifice Flow Meter Theory
The flow rate \(Q\) through an orifice plate is determined by several measured quantities. The relationship is governed by the following formulae:
1. Ratio of the orifice diameter \(d_2\) to the pipe diameter \(d_1\) (\(\beta\)):
2. Volumetric Flow Rate (\(Q\)):
The formula for the mass flow rate \(Q\) (in \(\text{kg/s}\)) based on the pressure drop \(\Delta p\) is given by:
Where: * \(C\): Discharge coefficient (accounts for friction) * \(\epsilon\): Expansibility factor (for compressible fluids) * \(d_1\): Pipe diameter * \(d_2\): Orifice diameter * \(\rho\): Fluid density * \(\Delta p\): Pressure drop across the orifice (in \(\text{Pa}\))
1.2 Input Values and Uncertainties
The following values and their corresponding Expanded Uncertainties (\(U\)) are provided for the flow meter calibration (Slides 4 and 5). Note that for calculations, we convert \(\Delta p\) from \(\text{kPa}\) to \(\text{Pa}\) (\(\text{SI}\) base unit).
| Quantity (\(X_i\)) | Symbol | Value (\(Y\)) | Units | Expanded Uncertainty (\(U\)) | Coverage Factor (\(k\)) |
|---|---|---|---|---|---|
| Discharge coefficient | \(C\) | \(0.6\) | - | \(0.003\) | \(2.0\) |
| Expansibility factor | \(\epsilon\) | \(0.997\) | - | \(0.00027\) | \(2.0\) |
| Pipe diameter | \(d_1\) | \(0.5\) | \(\text{m}\) | \(0.0001\) | \(1.73\) |
| Orifice diameter | \(d_2\) | \(0.3\) | \(\text{m}\) | \(0.00001\) | \(1.73\) |
| Pressure drop | \(\Delta p\) | \(50.0\) | \(\text{kPa}\) | \(100\) | \(2.0\) |
| Density | \(\rho\) | \(48.7\) | \(\text{kg/m}^3\) | \(0.146\) | \(2.0\) |
Python Setup and Variable Initialization
We will use the given values to calculate the flow rate \(Q\) and its associated combined standard uncertainty \(u_c(Q)\).
import numpy as np

# --- Input Values (Slide 4) ---
C = 0.6          # Discharge coefficient
epsilon = 0.997  # Expansibility factor
d1 = 0.5         # Pipe diameter (m)
d2 = 0.3         # Orifice diameter (m)
delta_p_kPa = 50.0
delta_p = delta_p_kPa * 1000 # Convert to Pa (50,000 Pa)
rho = 48.7       # Density (kg/m^3)
pi = np.pi

# --- Expanded Uncertainties U and Coverage Factors k (Slide 5 & 6) ---
U_C = 0.003; k_C = 2.0
U_epsilon = 0.00027; k_epsilon = 2.0
U_d1 = 0.0001; k_d1 = 1.73
U_d2 = 0.00001; k_d2 = 1.73
U_delta_p = 100; k_delta_p = 2.0 # U for delta_p in Pa
U_rho = 0.146; k_rho = 2.0
1.3 Flow Rate Calculation
First, calculate the diameter ratio \(\beta\) and the theoretical flow rate \(Q\).
# 1. Calculate diameter ratio beta
beta = d2 / d1
beta_squared = beta**2
beta_fourth = beta**4

# 2. Calculate Flow Rate Q (Calibrated Flow Rate from Slide 4 is 100.0 kg/s)
# Q = [C / sqrt(1 - beta^4)] * [epsilon * pi/4 * d1^2] * [sqrt(2 * rho * delta_p)]
Q_term1 = C / np.sqrt(1 - beta_fourth)
Q_term2 = epsilon * (pi/4) * d1**2
Q_term3 = np.sqrt(2 * rho * delta_p)

Q = Q_term1 * Q_term2 * Q_term3

print(f"Beta (β): {beta:.3f}")
print(f"Calculated Flow Rate (Q): {Q:.1f} kg/s")
# Note: The calculated value (100.0 kg/s) matches the Calibrated Flow Rate in Slide 4.
1.4 Uncertainty Budget (GUM Framework)
The combined standard uncertainty \(u_c(Q)\) is calculated using the formula:
Where: * \(u_i\): Standard uncertainty for input quantity \(X_i\) (\(u_i = U_i / k_i\)). * \(c_i\): Sensitivity coefficient (\(c_i = \frac{\partial Q}{\partial X_i}\)) * \(c_i u_i\): Uncertainty contribution to \(Q\).
The table below (from Slide 6) summarizes the step-by-step calculation.
| Quantity | Value (\(Y\)) | \(U\) | \(k\) | \(u = U/k\) | \(c\) | \(u \cdot c\) | \((u \cdot c)^2\) |
|---|---|---|---|---|---|---|---|
| \(C\) | \(0.6\) | \(0.003\) | \(2\) | \(0.0015\) | \(167\) | \(0.25\) | \(0.0628\) |
| \(\epsilon\) | \(0.997\) | \(0.00027\) | \(2\) | \(0.00013\) | \(100\) | \(0.0135\) | \(0.0002\) |
| \(d_1\) | \(0.5\) | \(0.0001\) | \(1.73\) | \(5.78\text{E-}5\) | \(-60\) | \(-0.0035\) | \(1.20\text{E-}5\) |
| \(d_2\) | \(0.3\) | \(0.00001\) | \(1.73\) | \(5.78\text{E-}6\) | \(766\) | \(0.0044\) | \(1.96\text{E-}5\) |
| \(\Delta p\) | \(50,000\) | \(100\) | \(2\) | \(50\) | \(0.001\) | \(0.05\) | \(0.0025\) |
| \(\rho\) | \(48.7\) | \(0.146\) | \(2\) | \(0.07305\) | \(1.03\) | \(0.075\) | \(0.0057\) |
| \(Q\) | \(100.0\) | \(0.533\) | \(2\) | \(0.267\) | \(1\) | \(0.267\) | \(0.0711\) |
Calculations based on the Table
We can verify the combined uncertainty \(u_c(Q)\) by summing the squared contributions.
# --- Standard Uncertainties (u = U/k) ---
u_C = U_C / k_C
u_epsilon = U_epsilon / k_epsilon
u_d1 = U_d1 / k_d1
u_d2 = U_d2 / k_d2
u_delta_p = U_delta_p / k_delta_p
u_rho = U_rho / k_rho

# --- Sensitivity Coefficients (c) from the table (Slide 6) ---
c_C = 167
c_epsilon = 100
c_d1 = -60
c_d2 = 766
c_delta_p = 0.001
c_rho = 1.03

# --- Squared Uncertainty Contributions (u*c)^2 from the table (Slide 6) ---
uc2_C = 0.0628
uc2_epsilon = 0.0002
uc2_d1 = 1.20E-5
uc2_d2 = 1.96E-5
uc2_delta_p = 0.0025
uc2_rho = 0.0057

# --- 7. Calculate Combined Squared Uncertainty Summation ---
sum_uc_squared = uc2_C + uc2_epsilon + uc2_d1 + uc2_d2 + uc2_delta_p + uc2_rho

# --- 8. Calculate Combined Standard Uncertainty (u_c) ---
u_c_Q = np.sqrt(sum_uc_squared)

# --- Final Expanded Uncertainty (U_Q) ---
# The table uses k=2 for the final Expanded Uncertainty (U = k * u_c).
k_final = 2
U_Q = k_final * u_c_Q

print(f"Sum of Squared Contributions (Σ(u·c)²): {sum_uc_squared:.4f} (Matches 0.0711 from table)")
print(f"Combined Standard Uncertainty (u_c): {u_c_Q:.3f} (Matches 0.267 from table)")
print(f"Expanded Uncertainty (U) for Q (k=2): {U_Q:.3f} (Matches 0.533 from table)")

# Final result for the flow rate: Q = 100.0 ± 0.533 kg/s (k=2)
Part 2: Calibration Example: Cylindrical Storage Tank
2.1 Volume and Thermal Expansion
The second example deals with calculating the volume of a cylindrical storage tank.
1. Governing Equation for Volume (\(V\)):
Where: * \(d\): Diameter * \(h\): Height
2. Thermal Expansion Correction:
If the measurement is taken at a temperature \(T_{\text{meas}}\) different from a standard reference temperature (e.g., \(15^\circ \text{C}\)), a correction for thermal expansion must be applied to the measured volume \(V_{\text{meas}}\).
Where \(\alpha\) is the cubical expansion coefficient. This correction introduces two new uncertainty sources: \(\alpha\) and \(T_{\text{meas}}\).
2.2 Uncertainty Budget (Uncorrelated Measurements)
This section examines the uncertainty budget for the final corrected volume, assuming all measurement sources are uncorrelated.
| Source | \(U\) | \(k\) | \(u\) | \(c\) | \(u \cdot c\) | \((u \cdot c)^2\) |
|---|---|---|---|---|---|---|
| Calibration (Diameter) | \(0.048\) | \(2.00\) | \(0.024\) | \(39.96\) | \(0.955\) | \(0.920\) |
| Determination (Diameter) | - | - | \(0.021\) | \(39.96\) | \(0.839\) | \(0.704\) |
| Time drift (Diameter) | \(0.005\) | \(1.73\) | \(0.003\) | \(39.96\) | \(0.115\) | \(0.013\) |
| Calibration (Height) | \(0.100\) | \(2.00\) | \(0.050\) | \(18.10\) | \(0.905\) | \(0.819\) |
| Resolution (Height) | \(0.026\) | \(1.73\) | \(0.015\) | \(18.10\) | \(0.272\) | \(0.074\) |
| Time drift (Height) | \(0.010\) | \(1.73\) | \(0.006\) | \(18.10\) | \(0.104\) | \(0.011\) |
| Temperature (\(T\)) | \(0.550\) | \(2.00\) | \(0.275\) | \(-0.004\) | \(-0.001\) | \(1.21\text{E-}6\) |
| Cubical Expansion (\(\alpha\)) | \(2.25\text{E-}6\) | \(1.73\) | \(1.3\text{E-}6\) | \(-1437\) | \(-0.002\) | \(3.49\text{E-}6\) |
| Volume (\(V\)) | \(3.188\) | \(2.00\) | \(1.594\) | \(1\) | \(1.594\) | \(2.541\) |
In the uncorrelated case, the combined standard uncertainty \(u_c(V)\) is calculated by taking the square root of the sum of the values in the \((u \cdot c)^2\) column (Total sum \(2.541\)).
The Expanded Uncertainty \(U\) is then calculated with \(k=2.00\): $\(U_{\text{uncorr}} = 2.00 \times 1.594 \approx 3.188\)$
2.3 Uncertainty Budget (Correlated Measurements)
When measurements are correlated, the uncertainty propagation formula must include a covariance term. For the correlation between two input quantities \(X_i\) and \(X_j\) with correlation coefficient \(r_{ij}\):
The presentation (Slide 10) shows the result when some measurements are considered correlated. A key example is often the correlation between the Calibration of Diameter and the Calibration of Height, as both might rely on the same potentially flawed reference standard.
| Source | \(U\) | \(k\) | \(u\) | \(c\) | \(u \cdot c\) | \((u \cdot c)^2\) |
|---|---|---|---|---|---|---|
| Calibration (Diameter) | \(0.048\) | \(2.00\) | \(0.024\) | \(39.96\) | \(\mathbf{0.955}\) | - |
| ... | ... | ... | ... | ... | ... | ... |
| Calibration (Height) | \(0.100\) | \(2.00\) | \(0.050\) | \(18.10\) | \(\mathbf{0.905}\) | \(\mathbf{3.475}\) |
| ... | ... | ... | ... | ... | ... | ... |
| Volume (\(V\)) | \(4.136\) | \(2.00\) | \(2.068\) | \(1\) | \(2.068\) | \(4.277\) |
Key Observation:
- The squared uncertainty for the Calibration (Height) is now \(3.475\), which is much larger than its uncorrelated value (\(0.819\)). This large value in the \((u \cdot c)^2\) column often represents the combined sum of the individual squared contribution \(\mathbf{(u_i c_i)^2}\) plus the covariance term \(\mathbf{2 \cdot (u_i c_i)(u_j c_j)r_{ij}}\).
- The final result for the Volume's expanded uncertainty \(U\) increased from \(3.188\) to \(4.136\).
- \(u_{c, \text{corr}} = \sqrt{4.277} \approx 2.068\)
- \(U_{\text{corr}} = 2.00 \times 2.068 \approx 4.136\)
Conclusion on Correlation: Including correlation, even for a few key sources, can significantly increase the total combined uncertainty of the final result.
Part 3: Typical Calibration Report
A typical calibration report (like the example for the ICP Accelerometer) provides essential information for uncertainty analysis, including:
- Calibration Data: Key measured characteristics (e.g., Voltage Sensitivity, Transverse Sensitivity, Output Bias Level).
- Key Specifications: Operational parameters (e.g., Range, Resolution, Time Constant).
- Frequency Response: A plot or table showing the deviation of the measured characteristic (e.g., Amplitude Deviation) across a range of frequencies. This information is crucial for dynamic, non-static error analysis.