This notebook presents the content of the SWGDRUG document as three distinct uncertainty budget examples.
Uncertainty Budget Examples (SWGDRUG SD-3)
This notebook details three examples of uncertainty budget calculations following the principles of the Guide to the Expression of Uncertainty in Measurement (GUM), as outlined in the SWGDRUG Supplemental Document SD-3.
General GUM Formulas
Standard Uncertainty (\(\boldsymbol{u_i}\))
Individual uncertainty components (\(\pm a_i\)) are converted to a standard uncertainty (\(u_i\)) by dividing by a factor based on its probability distribution.
| Distribution Type | Divisor | Use Case |
|---|---|---|
| Rectangular (Uniform) | \(\sqrt{3} \approx 1.732\) | Instrument resolution, tolerances, etc. |
| Normal (Gaussian) | \(k\) (Coverage Factor) | Calibration certificates where \(U\) is given, or Type A standard deviation. |
Combined Standard Uncertainty (\(\boldsymbol{u_c}\))
For independent components, the combined standard uncertainty is the Root Sum of Squares (RSS) of the individual standard uncertainties.
Expanded Uncertainty (\(\boldsymbol{U}\))
The final reported uncertainty is the expanded uncertainty, calculated using a coverage factor (\(k\)), typically \(k=2\) for approximately 95% confidence.
Example 1: Mass Measurement Uncertainty Budget
This example calculates the uncertainty associated with weighing a mass (\(m\)) on an analytical balance, with a target reading of \(0.10000 \text{ g}\).
A. Define Parameters
| Source of Uncertainty | Limit (\(\boldsymbol{a_i}\)) [g] | Divisor | Distribution |
|---|---|---|---|
| Resolution/Readability | \(\pm 0.00005\) | \(\sqrt{3}\) | Rectangular |
| Calibration Certificate | \(\pm 0.00005\) | \(k=2\) | Normal |
| Linearity | \(\pm 0.00010\) | \(\sqrt{3}\) | Rectangular |
| Drift | \(\pm 0.00005\) | \(\sqrt{3}\) | Rectangular |
B. Python Calculation
import numpy as np
import pandas as pd
import matplotlib.pyplot as plt
a_readability = 5e-05
# 1. Define limits (a_i) and divisors
a_calibration = 5e-05
a_linearity = 0.0001
a_drift = 5e-05
div_readability = np.sqrt(3)
div_calibration = 2.0
div_linearity = np.sqrt(3)
div_drift = np.sqrt(3)  # k=2 assumed for normal distribution on certificate
u_readability = a_readability / div_readability
u_calibration = a_calibration / div_calibration
u_linearity = a_linearity / div_linearity
# 2. Calculate Standard Uncertainty (u_i)
u_drift = a_drift / div_drift
u_c_mass = np.sqrt(u_readability ** 2 + u_calibration ** 2 + u_linearity ** 2 + u_drift ** 2)
_k = 2.0
U_mass = _k * u_c_mass
print(f'--- Mass Uncertainty Budget (g) ---')
# 3. Calculate Combined Standard Uncertainty (u_c)
print(f'Standard Uncertainty from Readability: {u_readability:.7f} g')
print(f'Standard Uncertainty from Calibration: {u_calibration:.7f} g')
# 4. Calculate Expanded Uncertainty (U)
print(f'Standard Uncertainty from Linearity:   {u_linearity:.7f} g')
print(f'Standard Uncertainty from Drift:       {u_drift:.7f} g')
print('-' * 40)
print(f'Combined Standard Uncertainty (u_c): {u_c_mass:.7f} g')
print(f'Expanded Uncertainty (U, k={_k}):    {U_mass:.7f} g')
--- Mass Uncertainty Budget (g) ---
Standard Uncertainty from Readability: 0.0000289 g
Standard Uncertainty from Calibration: 0.0000250 g
Standard Uncertainty from Linearity:   0.0000577 g
Standard Uncertainty from Drift:       0.0000289 g
----------------------------------------
Combined Standard Uncertainty (u_c): 0.0000750 g
Expanded Uncertainty (U, k=2.0):    0.0001500 g
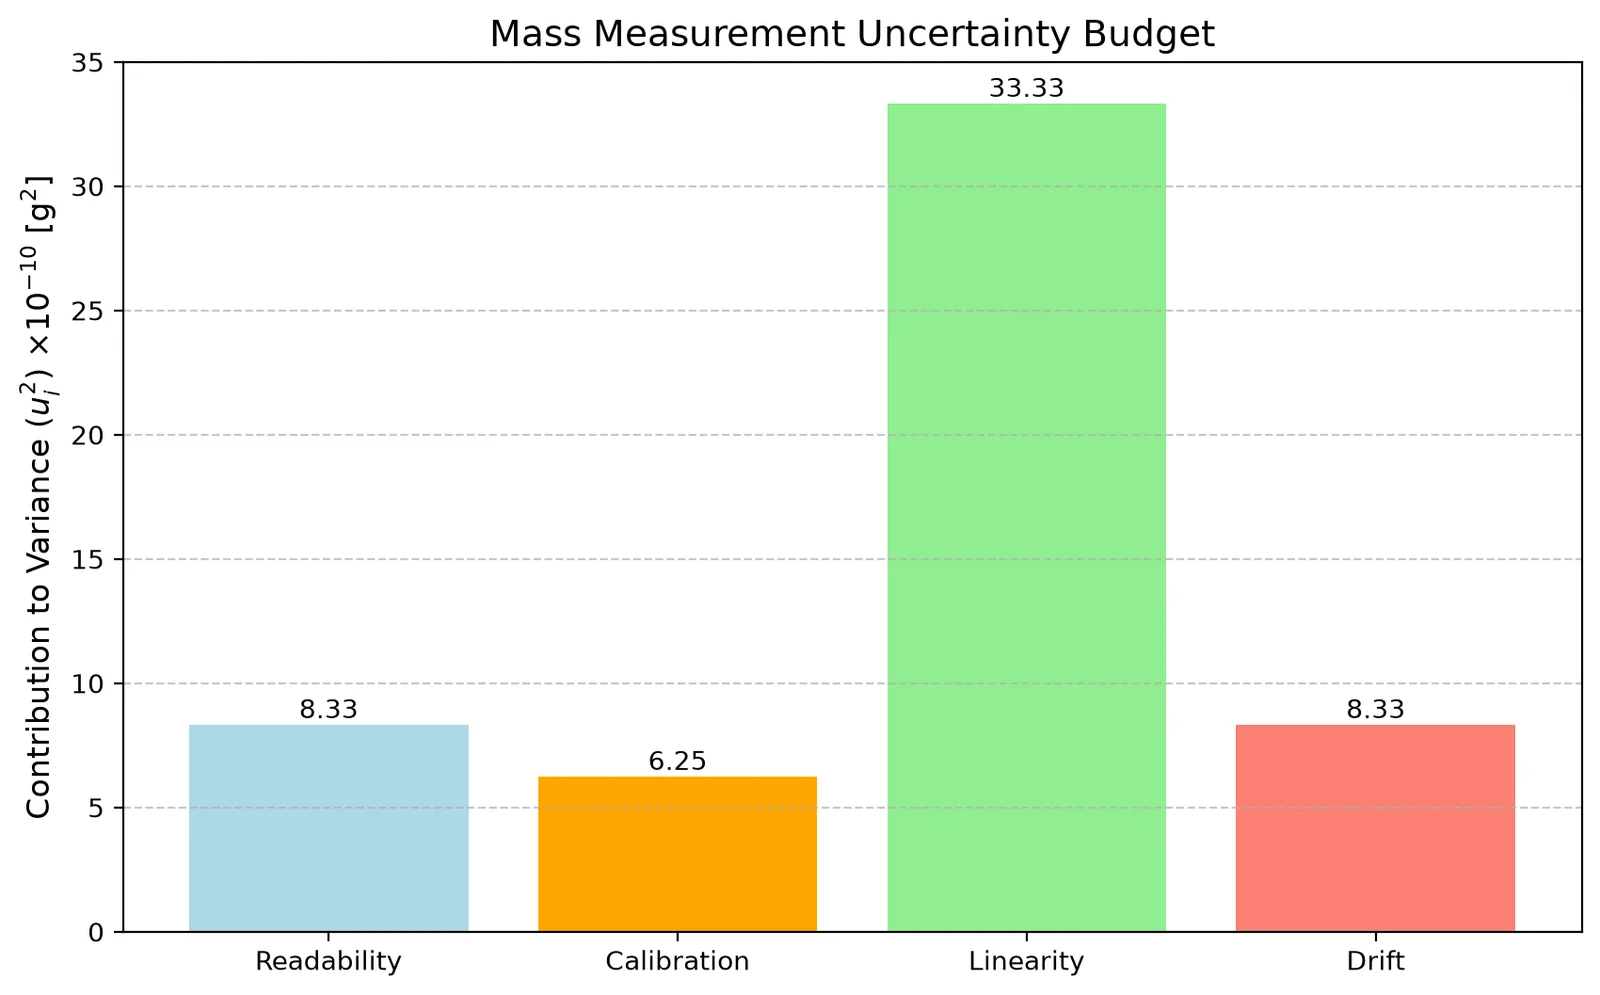
C. Uncertainty Budget Graph
# Create a DataFrame for plotting the budget
mass_data = {'Source': ['Readability', 'Calibration', 'Linearity', 'Drift'], 'u_i': [u_readability, u_calibration, u_linearity, u_drift]}
df_mass = pd.DataFrame(mass_data)
df_mass['Contribution (u_i^2)'] = df_mass['u_i'] ** 2
plt.figure(figsize=(10, 6))
_bars = plt.bar(df_mass['Source'], df_mass['Contribution (u_i^2)'] * 10000000000.0, color=['lightblue', 'orange', 'lightgreen', 'salmon'])
plt.ylabel('Contribution to Variance ($u_i^2$) $\\times 10^{-10}$ [$\\mathrm{g}^2$]', fontsize=12)
plt.title('Mass Measurement Uncertainty Budget', fontsize=14)
# Plotting the contribution (variance)
plt.grid(axis='y', linestyle='--', alpha=0.7)
for _bar in _bars:
    _yval = _bar.get_height()
    plt.text(_bar.get_x() + _bar.get_width() / 2, _yval + 0.01, f'{_yval:.2f}', ha='center', va='bottom', fontsize=10)
# Add text labels on bars
plt.show()
Example 2: Volume Measurement Uncertainty Budget
This example calculates the uncertainty associated with the volume (\(V\)) delivered by a \(5 \text{ mL}\) volumetric flask at a target temperature of \(20 \text{ °C}\).
A. Define Parameters
| Source of Uncertainty | Limit (\(\boldsymbol{a_i}\)) [mL] | Divisor | Distribution | Notes |
|---|---|---|---|---|
| Calibration Certificate | \(\pm 0.003\) | \(k=2\) | Normal | From certificate's \(U\). |
| Temperature | \(\pm 0.00085\) | \(\sqrt{3}\) | Rectangular | Calculated uncertainty due to thermal expansion and \(\Delta T\). |
B. Python Calculation
# 1. Define limits (a_i) and divisors
a_cal_vol = 0.003
a_temp_vol = 0.00085  # This value is based on the final uncertainty of the volume measurement
div_cal_vol = 2.0
div_temp_vol = np.sqrt(3)
u_cal_vol = a_cal_vol / div_cal_vol
u_temp_vol = a_temp_vol / div_temp_vol
# 2. Calculate Standard Uncertainty (u_i)
u_c_volume = np.sqrt(u_cal_vol ** 2 + u_temp_vol ** 2)
_k = 2.0
U_volume = _k * u_c_volume
# 3. Calculate Combined Standard Uncertainty (u_c)
print(f'--- Volume Uncertainty Budget (mL) ---')
print(f'Standard Uncertainty from Calibration: {u_cal_vol:.7f} mL')
# 4. Calculate Expanded Uncertainty (U)
print(f'Standard Uncertainty from Temperature: {u_temp_vol:.7f} mL')
print('-' * 40)
print(f'Combined Standard Uncertainty (u_c): {u_c_volume:.7f} mL')
print(f'Expanded Uncertainty (U, k={_k}):    {U_volume:.7f} mL')
--- Volume Uncertainty Budget (mL) ---
Standard Uncertainty from Calibration: 0.0015000 mL
Standard Uncertainty from Temperature: 0.0004907 mL
----------------------------------------
Combined Standard Uncertainty (u_c): 0.0015782 mL
Expanded Uncertainty (U, k=2.0):    0.0031565 mL
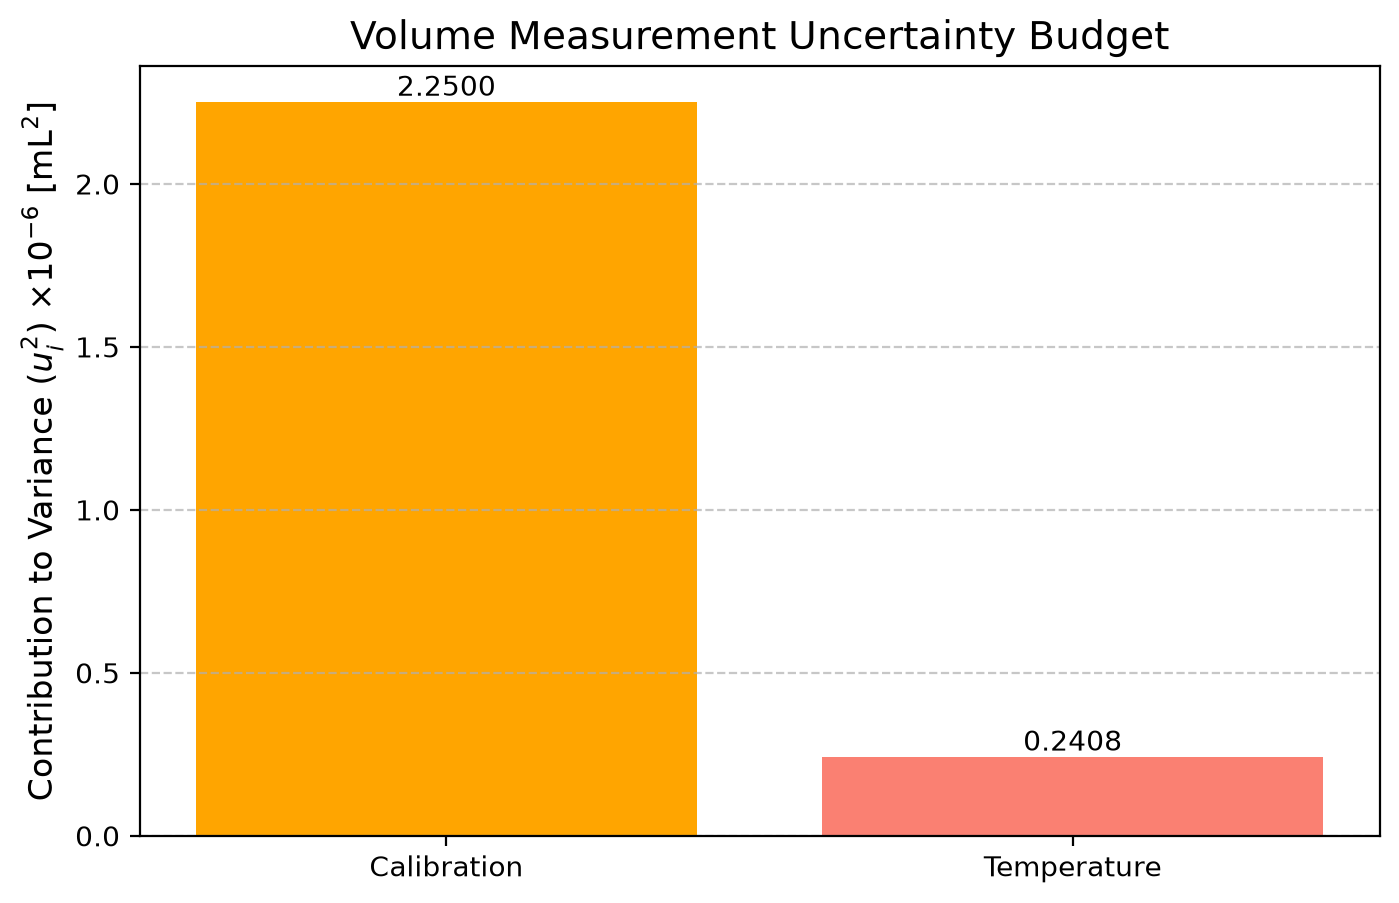
C. Uncertainty Budget Graph
# Create a DataFrame for plotting the budget
volume_data = {'Source': ['Calibration', 'Temperature'], 'u_i': [u_cal_vol, u_temp_vol]}
df_volume = pd.DataFrame(volume_data)
df_volume['Contribution (u_i^2)'] = df_volume['u_i'] ** 2
plt.figure(figsize=(8, 5))
_bars = plt.bar(df_volume['Source'], df_volume['Contribution (u_i^2)'] * 1000000.0, color=['orange', 'salmon'])
plt.ylabel('Contribution to Variance ($u_i^2$) $\\times 10^{-6}$ [$\\mathrm{mL}^2$]', fontsize=12)
plt.title('Volume Measurement Uncertainty Budget', fontsize=14)
# Plotting the contribution (variance)
plt.grid(axis='y', linestyle='--', alpha=0.7)
for _bar in _bars:
    _yval = _bar.get_height()
    plt.text(_bar.get_x() + _bar.get_width() / 2, _yval + 0.0001, f'{_yval:.4f}', ha='center', va='bottom', fontsize=10)
# Add text labels on bars
plt.show()
Example 3: Concentration of a Standard Solution
This example calculates the uncertainty of the concentration (\(C\)) of a solution prepared by dissolving the mass (\(m\)) from Example 1 into the volume (\(V\)) from Example 2.
The mathematical model for concentration is a quotient: $\(C = \frac{m}{V}\)$
For models involving multiplication and division, it is standard practice to calculate the relative combined standard uncertainty (\(\frac{u_c(C)}{C}\)) and then convert back to absolute uncertainty.
A. Relative Uncertainty Formulas (\(\LaTeX\))
The relative combined standard uncertainty is given by the formula:
The absolute combined standard uncertainty is then: $\(u_c(C) = C \cdot \frac{u_c(C)}{C}\)$
B. Define Parameters (from Examples 1 and 2)
- Mass (\(m\)): \(0.10000 \text{ g}\)
- Standard Uncertainty of Mass (\(\boldsymbol{u(m)}\)): \(u_{c\_mass} = 0.000085 \text{ g}\) (from Ex 1)
- Volume (\(V\)): \(5.000 \text{ mL}\)
- Standard Uncertainty of Volume (\(\boldsymbol{u(V)}\)): \(u_{c\_volume} = 0.001584 \text{ mL}\) (from Ex 2)
C. Python Calculation
# 1. Define input values and their standard uncertainties
m = 0.1  # Mass (g)
V = 5.0  # Volume (mL)
u_m = u_c_mass  # Combined standard uncertainty of mass (g)
u_V = u_c_volume  # Combined standard uncertainty of volume (mL)
C = m / V
# 2. Calculate the Concentration (C)
rel_u_m = u_m / m
rel_u_V = u_V / V
# 3. Calculate Relative Standard Uncertainties
rel_u_c_C = np.sqrt(rel_u_m ** 2 + rel_u_V ** 2)
u_c_C = C * rel_u_c_C
_k = 2.0
# 4. Calculate Relative Combined Standard Uncertainty (rel_u_c_C)
U_C = _k * u_c_C
print(f'--- Concentration Uncertainty Budget (g/mL) ---')
# 5. Calculate Absolute Combined Standard Uncertainty (u_c_C)
print(f'Concentration (C): {C:.5f} g/mL')
print('-' * 40)
# 6. Calculate Expanded Uncertainty (U_C)
print(f'Relative u(m): {rel_u_m:.5f} (0.0{rel_u_m * 100:.3f} %)')
print(f'Relative u(V): {rel_u_V:.5f} (0.0{rel_u_V * 100:.3f} %)')
print('-' * 40)
print(f'Relative Combined Standard Uncertainty: {rel_u_c_C:.5f}')
print(f'Absolute Combined Standard Uncertainty (u_c): {u_c_C:.7f} g/mL')
print(f'Expanded Uncertainty (U, k={_k}):    {U_C:.7f} g/mL')
--- Concentration Uncertainty Budget (g/mL) ---
Concentration (C): 0.02000 g/mL
----------------------------------------
Relative u(m): 0.00075 (0.00.075 %)
Relative u(V): 0.00032 (0.00.032 %)
----------------------------------------
Relative Combined Standard Uncertainty: 0.00081
Absolute Combined Standard Uncertainty (u_c): 0.0000163 g/mL
Expanded Uncertainty (U, k=2.0):    0.0000325 g/mL
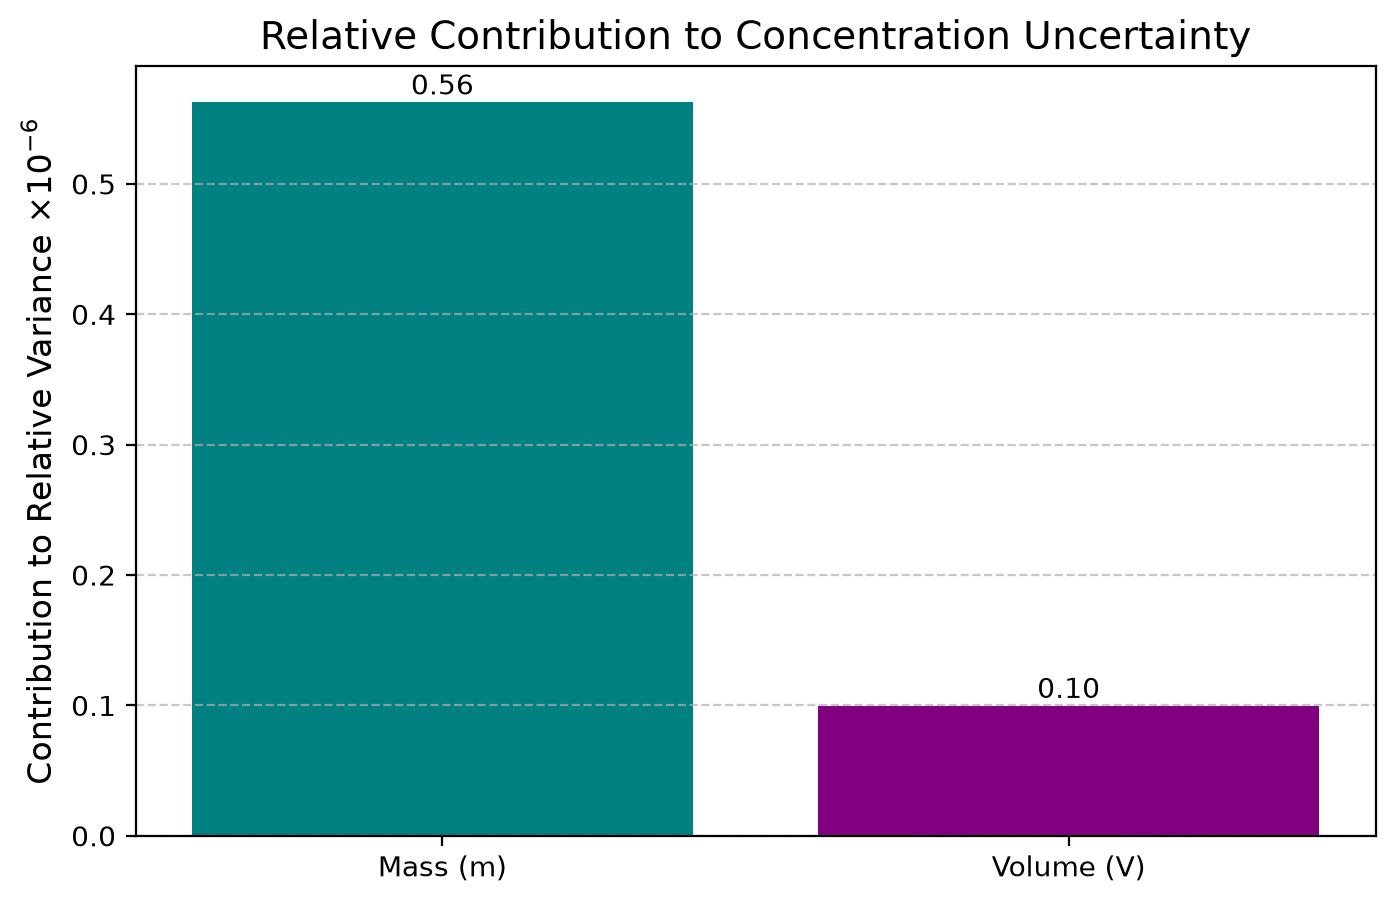
D. Relative Contribution Graph
This graph shows which input quantity (mass or volume) contributes the most to the overall uncertainty of the concentration.
# Create a DataFrame for plotting the relative contribution
concentration_data = {'Source': ['Mass (m)', 'Volume (V)'], 'Relative u_i': [rel_u_m, rel_u_V]}
df_conc = pd.DataFrame(concentration_data)
df_conc['Contribution to Relative Variance'] = df_conc['Relative u_i'] ** 2
plt.figure(figsize=(8, 5))
_bars = plt.bar(df_conc['Source'], df_conc['Contribution to Relative Variance'] * 1000000.0, color=['teal', 'purple'])
plt.ylabel('Contribution to Relative Variance $\\times 10^{-6}$', fontsize=12)
plt.title('Relative Contribution to Concentration Uncertainty', fontsize=14)
# Plotting the contribution (relative variance)
plt.grid(axis='y', linestyle='--', alpha=0.7)
for _bar in _bars:
    _yval = _bar.get_height()
    plt.text(_bar.get_x() + _bar.get_width() / 2, _yval + 0.001, f'{_yval:.2f}', ha='center', va='bottom', fontsize=10)
# Add text labels on bars
plt.show()