import matplotlib.pyplot as plt
import numpy as np

from numpy import fft

import matplotlib as mpl
mpl.rc('font', size=14)
mpl.rc('figure',figsize=(12,10))
# Given:
f_s = 100.0
T = 3.0  # sampling frequency (Hz)
g = np.loadtxt('data/FFT_Example_data_with_window.txt')  # total actual sample time (s)
for i in range(10):
# add noise
    g = g + np.random.rand(g.shape[0])
# Calculate
N = f_s * T  #total actual number of data points
del_t = 1.0 / f_s  #(s)
del_f = 1.0 / T  #(Hz)
f_fold = f_s / 2.0  #folding frequency = max frequency of FFT (Hz)
N_freq = N / 2.0  #number of discrete frequencies
t = np.arange(0.0, T + del_t, del_t)
g_1 = g + 1.2 * np.sin(2 * np.pi * 10 * t)  #time, t (s)
frequency = np.arange(0, f_fold, del_f)
G = fft.fft(g_1)
Magnitude = np.abs(G) / (N / 2.0)
Magnitude[0] = Magnitude[0] / 2
_len_loc, = Magnitude.shape
A = Magnitude[0:int(round(_len_loc / 2))]
Freq = frequency[0:int(round(_len_loc / 2))]
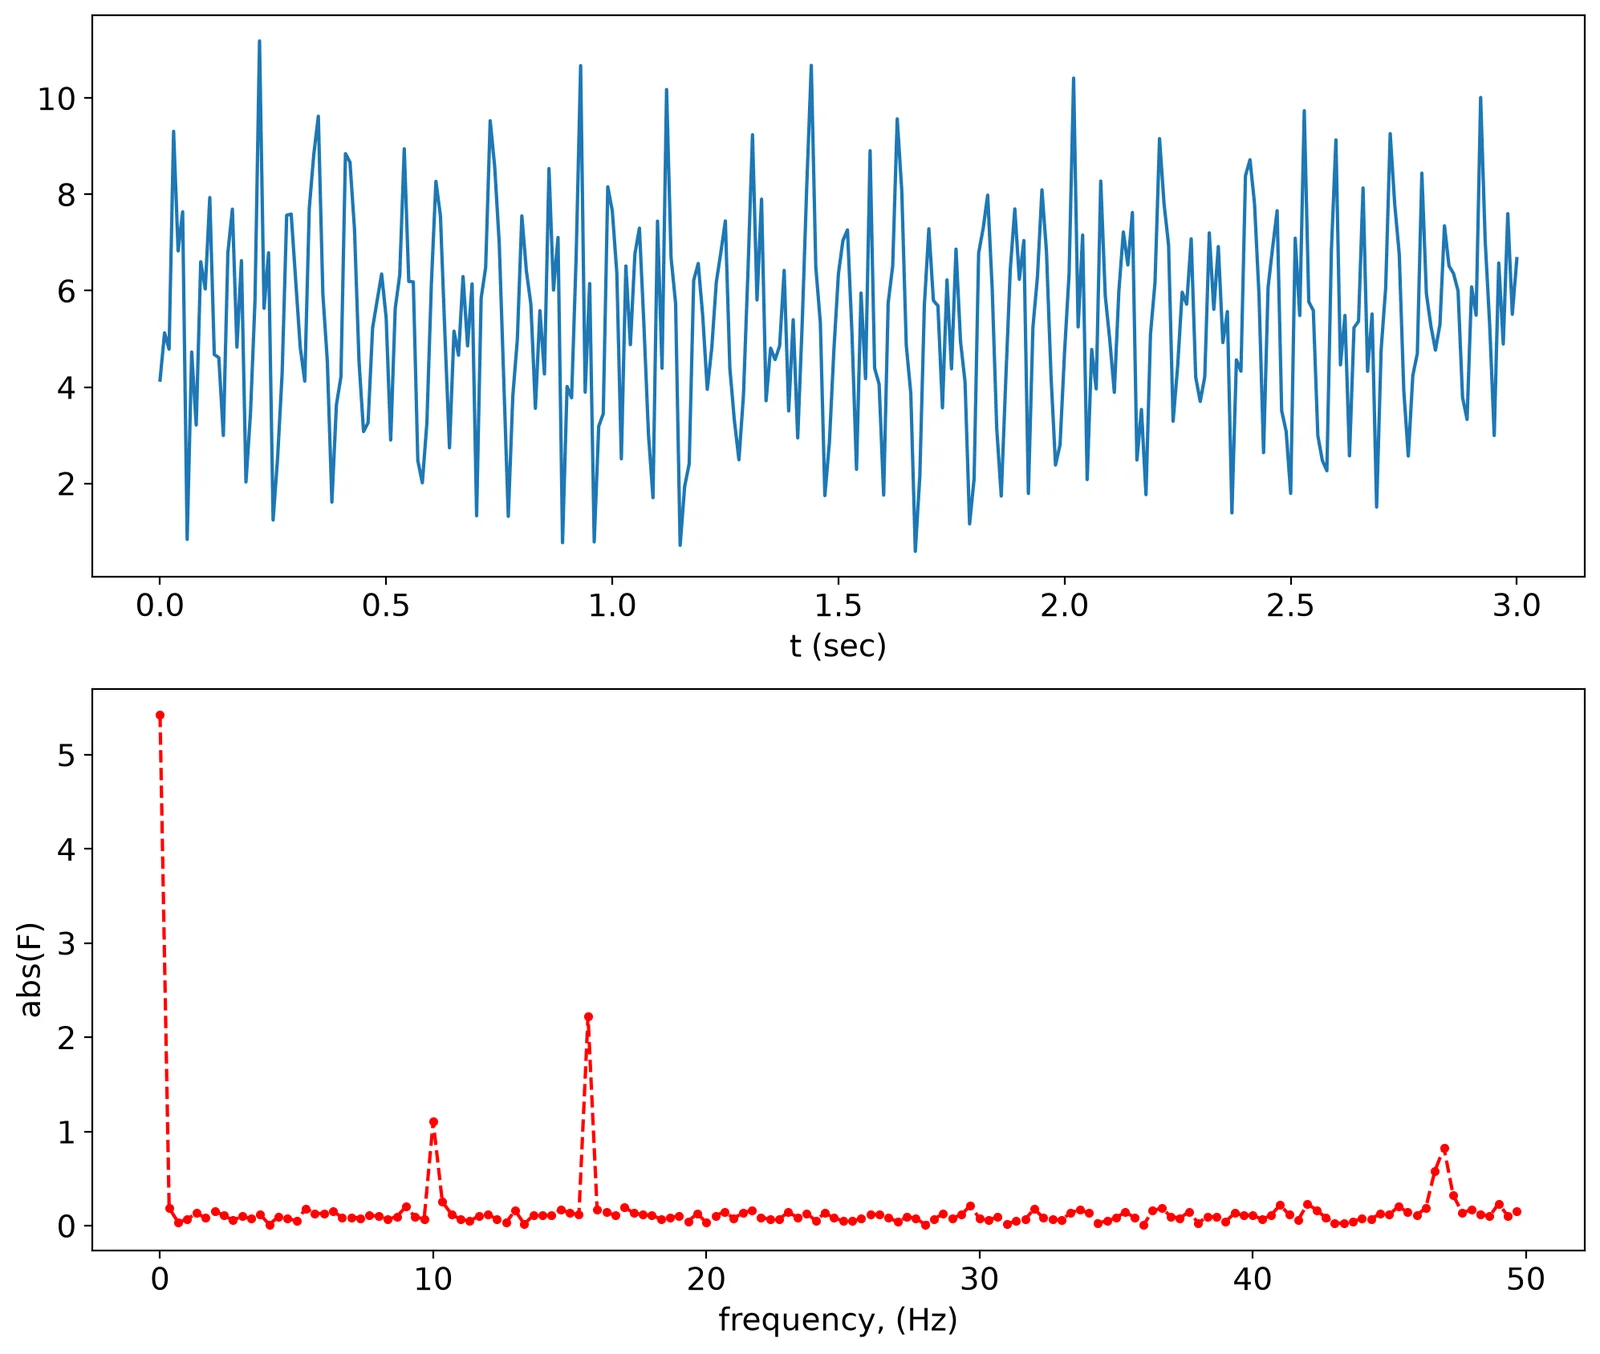
_fig, _ax = plt.subplots(2, 1)
_ax[0].plot(t, g_1)
_ax[0].set_xlabel('t (sec)')
_ax[1].set_ylabel('E (volts)')
_ax[1].plot(Freq, A, 'r--.')
_ax[1].set_xlabel('frequency, (Hz)')
_ax[1].set_ylabel('abs(F)')
N_2 = int(2 ** np.fix(np.log2(N)))
T_2 = N_2 / f_s
del_f_2 = 1 / T_2
N_freq_2 = N_2 / 2
t_2 = np.arange(0.0, T_2, del_t)
frequency_2 = np.arange(0, f_fold, del_f_2)
len2, = t_2.shape
g_2 = g_1[:len2]
DC_2 = np.mean(g_2)
g_uncoupled_2 = g_2 - DC_2
u_Hann_2 = 0.5 * (1 - np.cos(2 * np.pi * t_2 / T_2))
g_Hann_2 = g_uncoupled_2 * u_Hann_2
G_Hann_2 = fft.fft(g_Hann_2, N_2)
Magnitude_Hann_2 = np.abs(G_Hann_2) * np.sqrt(8.0 / 3.0) / (N_2 / 2)
Magnitude_Hann_2[0] = Magnitude_Hann_2[0] / 2 + DC_2
_len_loc, = Magnitude_Hann_2.shape
A_2 = Magnitude_Hann_2[0:int(round(_len_loc / 2))]
Freq_2 = frequency_2[0:int(round(_len_loc / 2))]
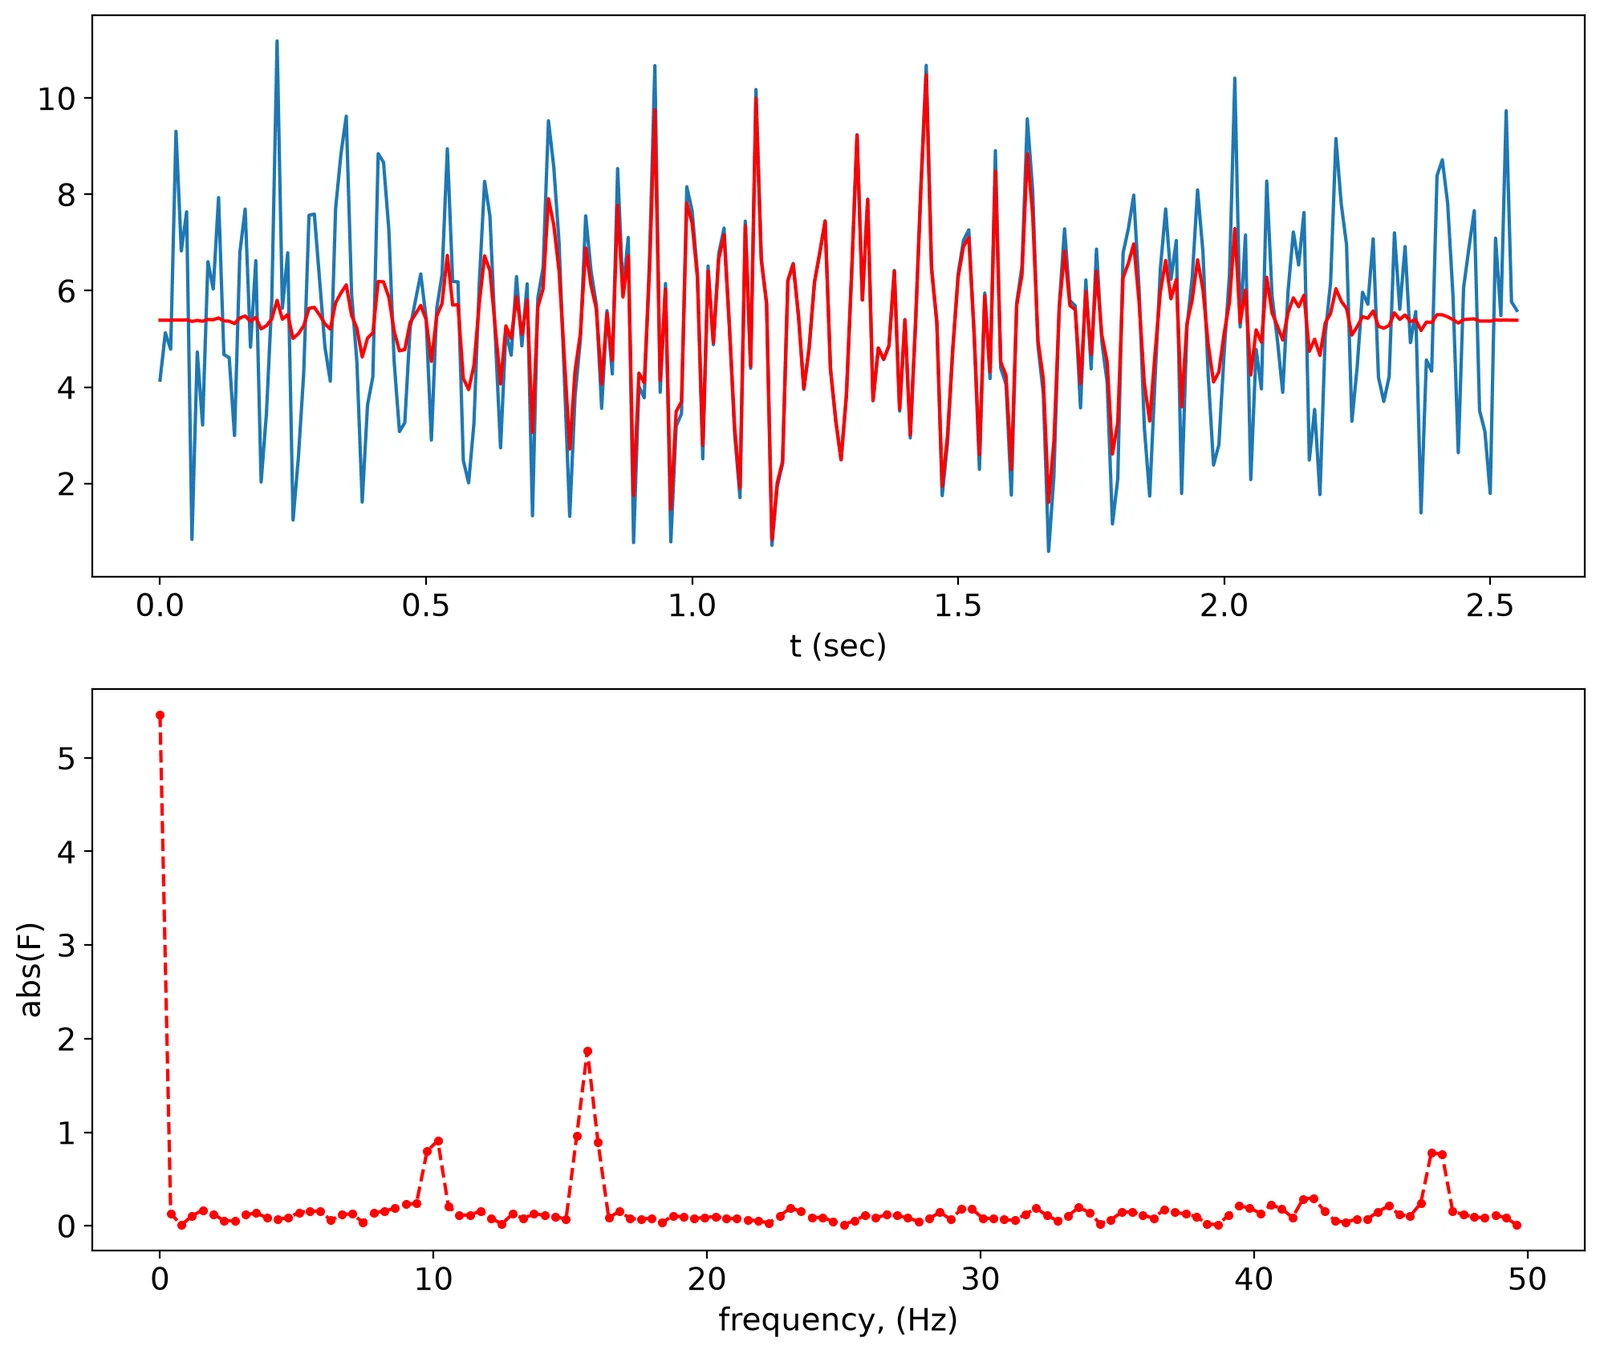
_fig, _ax = plt.subplots(2, 1)
_ax[0].plot(t_2, g_2)
_ax[0].plot(t_2, g_Hann_2 + DC_2, 'r')
_ax[0].set_xlabel('t (sec)')
_ax[1].set_ylabel('E (volts)')
_ax[1].plot(Freq_2, A_2, 'r--.')
_ax[1].set_xlabel('frequency, (Hz)')
_ax[1].set_ylabel('abs(F)')
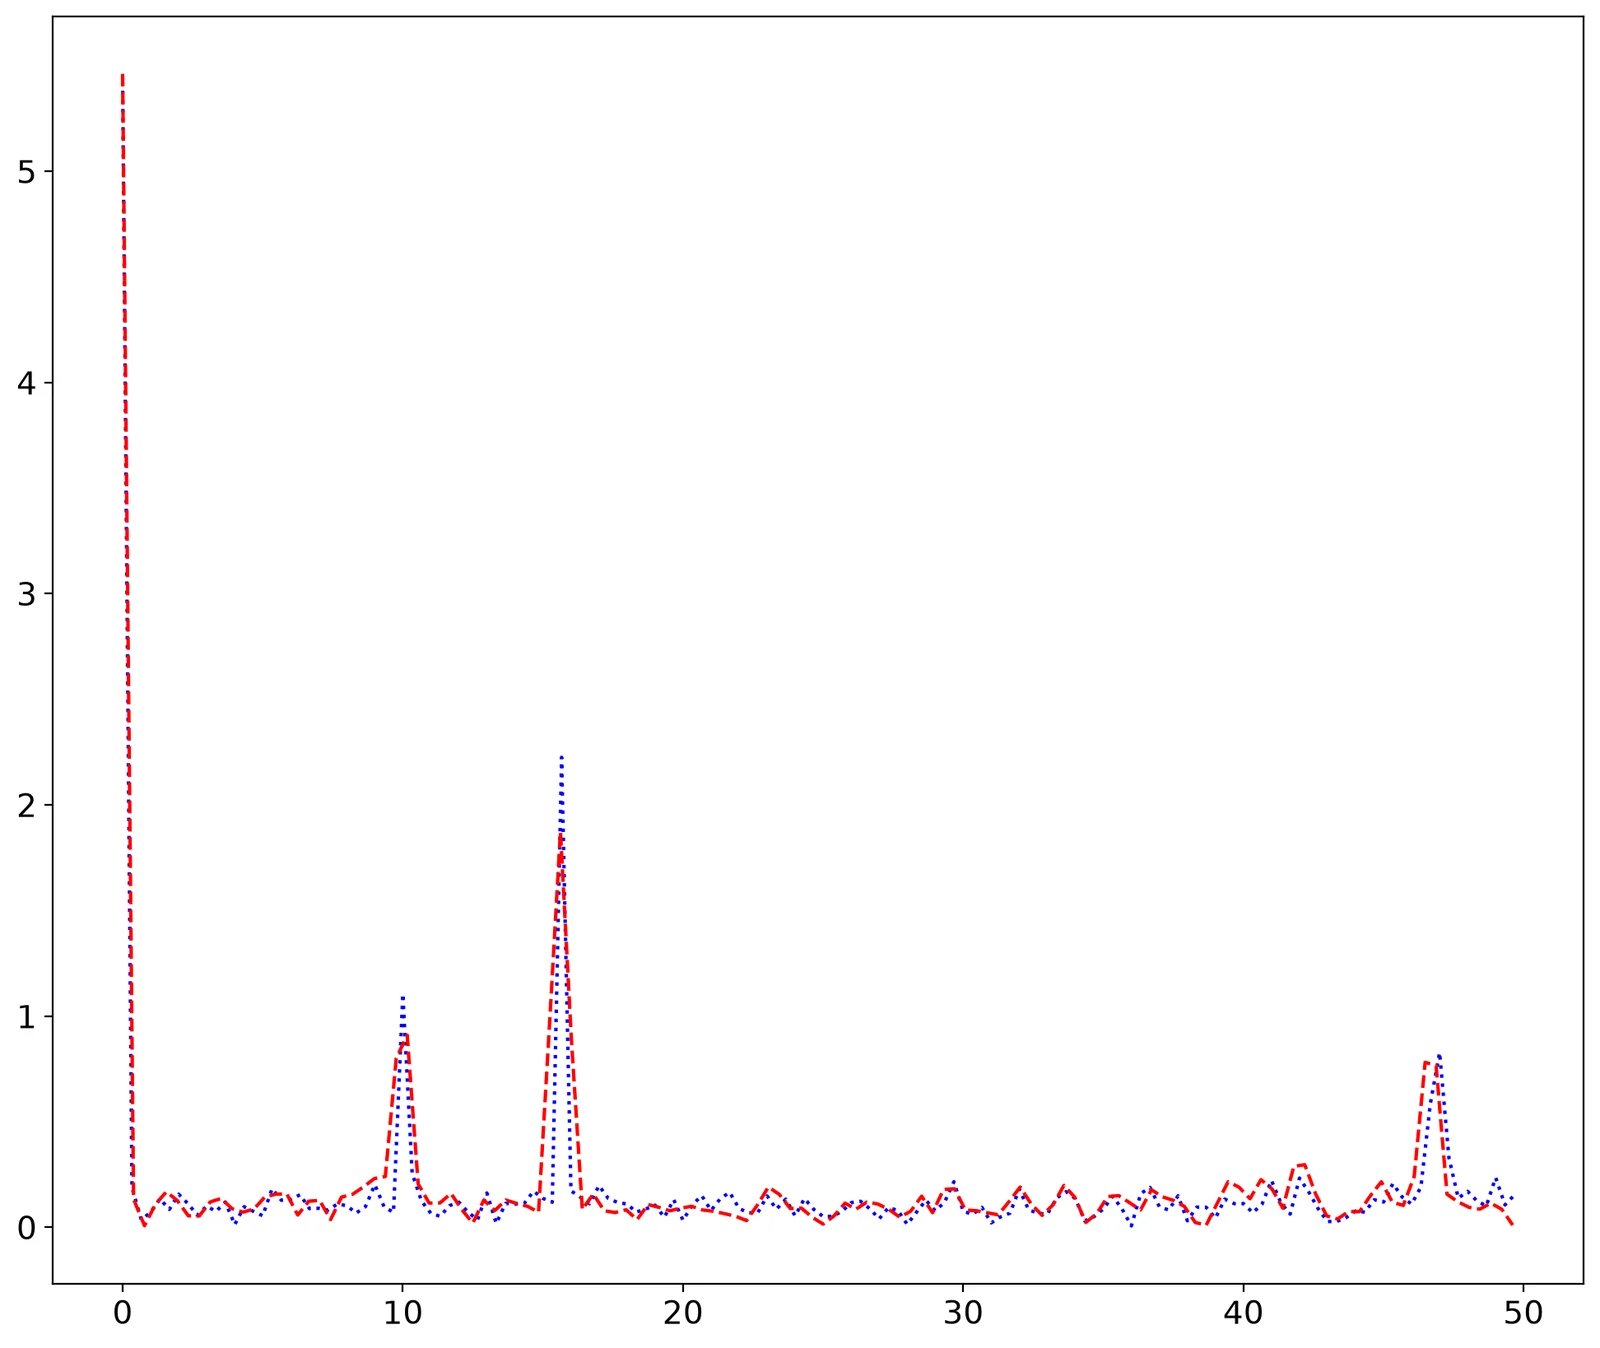
plt.plot(Freq,A,'b:',Freq_2,A_2,'r--')