import numpy as np
import matplotlib.pyplot as plt
from scipy.fftpack import fft
N = 600
# Number of samplepoints
T = 1.0 / 800.0
# sample spacing
x = np.linspace(0.0, N * T, N)
y = np.sin(50.0 * 2.0 * np.pi * x) + 0.5 * np.sin(80.0 * 2.0 * np.pi * x)
yf = fft(y)
halfN = int(N / 2)
xf = np.linspace(0.0, 1.0 / (2.0 * T), halfN)
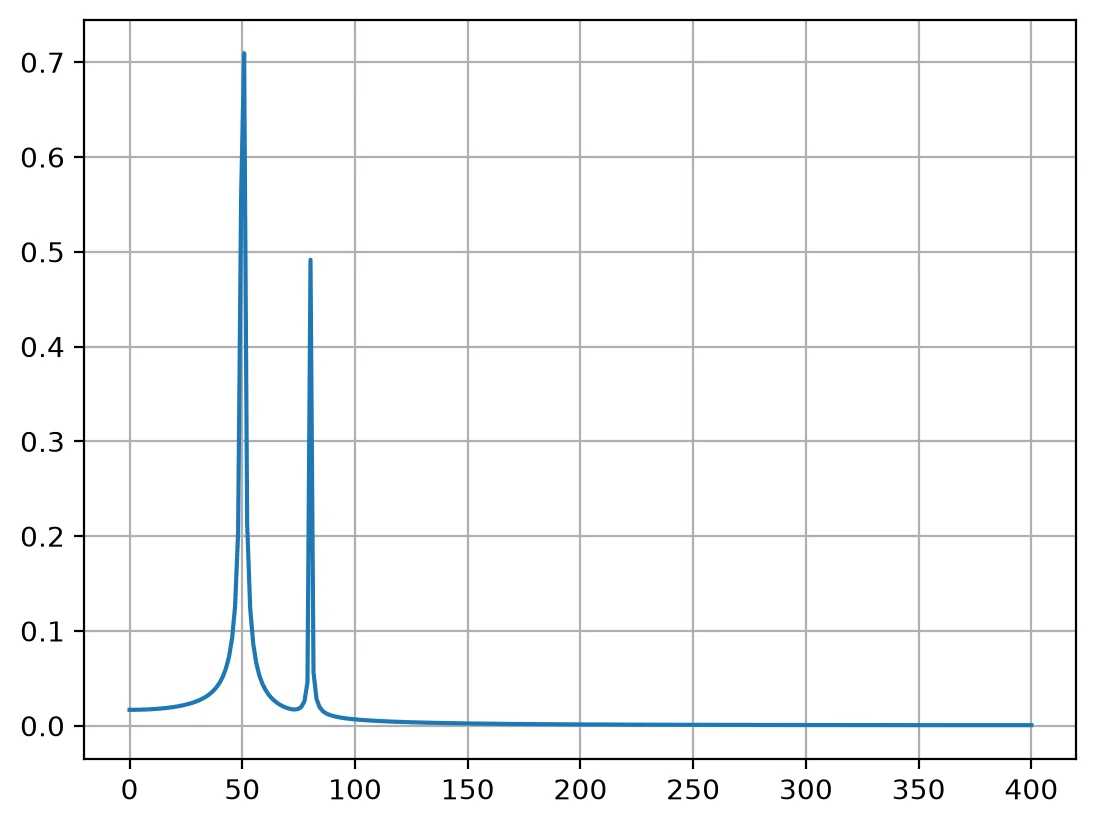
plt.plot(xf, 2.0 / N * np.abs(yf[0:halfN]))
plt.grid()
plt.show()
plt.figure()
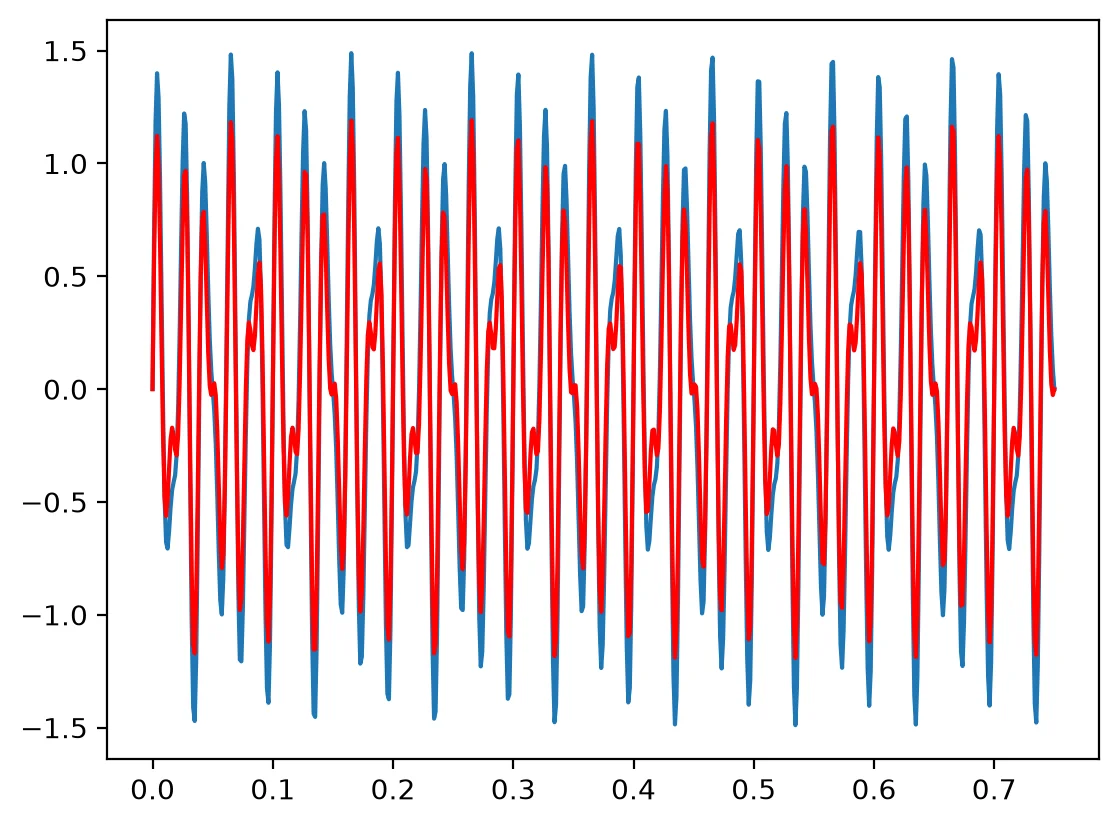
plt.plot(x,y)
plt.plot(x,0.7*np.sin(50.0 * 2.0*np.pi*x) + 0.5*np.sin(80.0 * 2.0*np.pi*x),'r')
from scipy.signal.windows import hann
w = hann(N)
ywf = fft(y*w)
plt.figure()
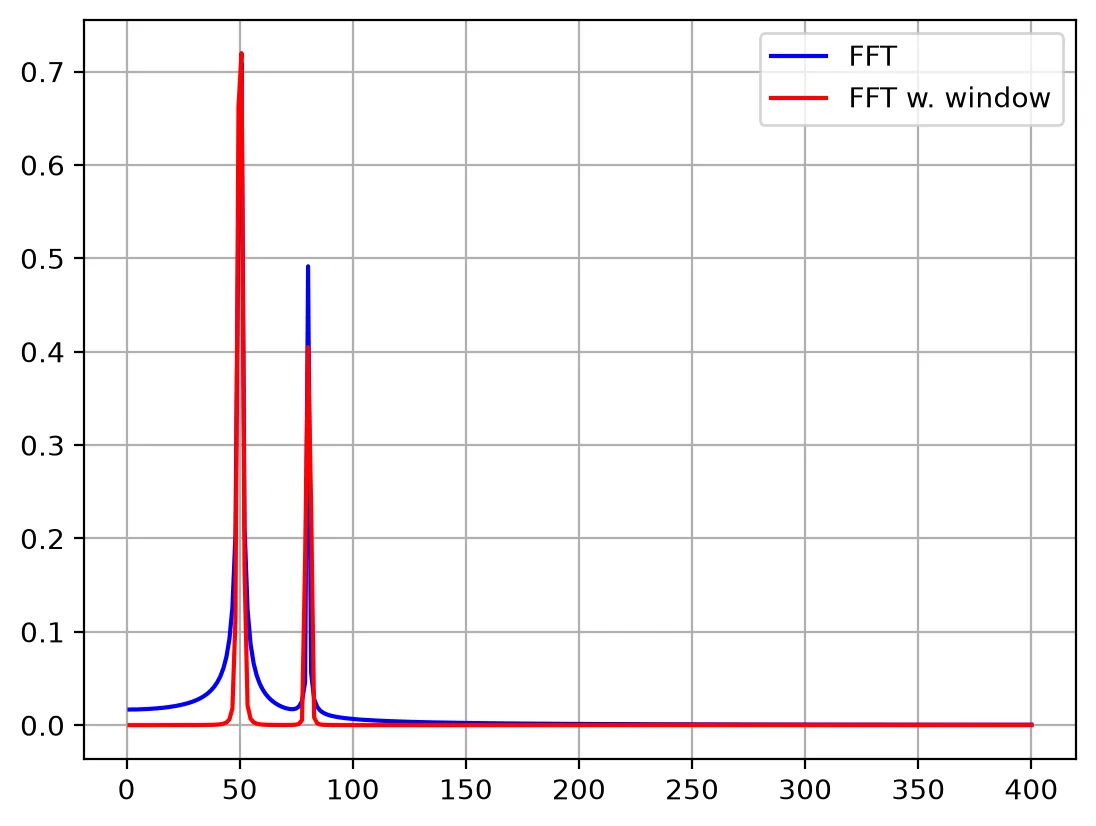
plt.plot(xf[1:halfN], 2.0/N * np.abs(yf[1:halfN]), '-b')
plt.plot(xf[1:halfN], np.sqrt(8/3)*2.0/N * np.abs(ywf[1:halfN]), '-r')
plt.legend(['FFT', 'FFT w. window'])
plt.grid()
plt.show()