Calibration and Uncertainty: Virtual Experiment, Abridged
ptrue = 10.000
p = np.array([10.02, 10.20, 10.26, 10.20, 10.22, 10.13, 9.97, 10.12, 10.09, 9.9, 10.05, 10.17, 10.42, 10.21, 10.23, 10.11, 9.98, 10.10, 10.04, 9.81])
Let's build histogram, we need to select the number of bins or \(\Delta p\)
Recommendations for choice of the histogram size:
\(k\) or number of bins shall be at least 5:
\(k \geq 5\)
There are several different methods to estimate the right number of bins for the histogram:
\(K = 1.87(N-1)^{0.4} + 1\)
or
\(K = N^{1/2}\)
histogram is defined as: $ Z = \frac{n(y)}{N \Delta y}$
where \(\Delta y\) bin size, \(N\) total number of readings, \(n(y)\) is the number of readings in some bin, centered at \(y\)
K = 1.87*(p.size - 1)**(0.4);
print (K)
K = np.sqrt(p.size);
print (K)
K = 9
dp = (np.max(p) - np.min(p))/K;
print (dp)
bins = np.r_[np.min(p)-dp:np.max(p)+dp:dp];
print (bins) # row vector
6.0721577674237
4.47213595499958
0.06777777777777771
[ 9.74222222  9.81        9.87777778  9.94555556 10.01333333 10.08111111
 10.14888889 10.21666667 10.28444444 10.35222222 10.42      ]
array([0, 1, 1, 2, 3, 5, 4, 3, 0, 1])
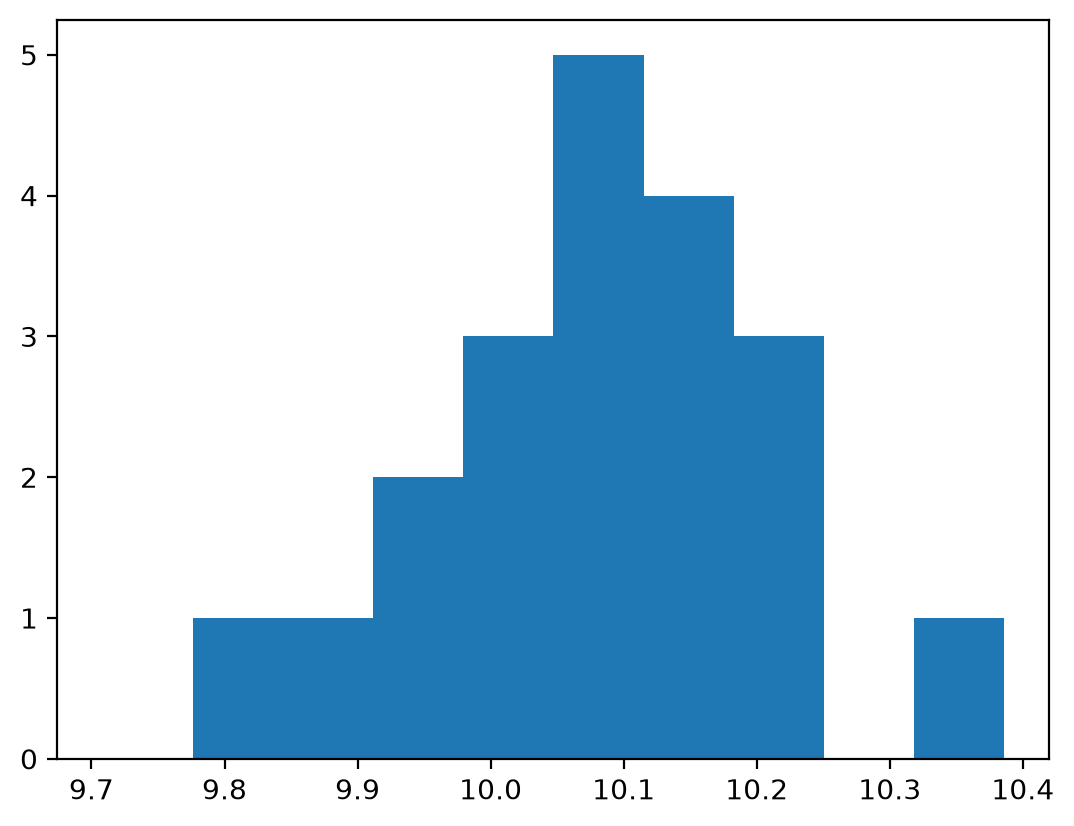
we expect to see the Gaussian, if our pressure measurements contain random errors
mu = np.mean(p)
sigma = np.std(p)
print( 'mean, std %3.2f, %3.2f' % (mu, sigma))
x = np.linspace(9.7,10.5,100)
gauss = 1./np.sqrt(2*np.pi*sigma**2)*np.exp(-((x-mu)**2/(2*sigma**2)))
mean, std 10.11, 0.13
- 0: 9.5
- 1: 10.6
\(\chi^2\) test
How do we check if our histogram is similar to the Gaussian (or any other) distribution? Goodness-of-fit is called the \(\chi^2\) test
$\chi^2 = \sum\limits_{i=1}^{n} \frac{(measured_i - expected_i)^2}{expected_i} $
gauss_1 = 1.0 / np.sqrt(2 * np.pi * sigma ** 2) * np.exp(-((bin_edges[:-1] + dp / 2.0 - mu) ** 2 / (2 * sigma ** 2)))
chisq = np.sum((hist - gauss_1) ** 2 / gauss_1)
print('$\\chi^2$ = %f' % chisq)
$\chi^2$ = 6.126602
# degrees of freedom = number of bins minus the (order of the fit + 1):
print ('Number of degrees of freedom,  K - (m+1) = %d' % (K - 2))
Number of degrees of freedom, K - (m+1) = 7
from scipy import stats
pval = 1 - stats.chi2.cdf(chisq, K-2);
print ('Confidence level is %3.1f percent' % (pval*100)  )
Image(filename='images/chi_square_graph.png')
Confidence level is 52.5 percent
we conclude that for the given set of measurements we are only 50% certain that we can use the Gaussian distribution assumptions
Calibration
# Increasing pressure:
p_in_up = np.linspace(0.0,10.0,11)
p_out_up = np.array([-1.12, 0.21, 1.18, 2.09, 3.33, 4.50, 5.26, 6.59, 7.73, 8.68, 9.8])
# Decreasing pressure
p_in_down = np.flipud(p_in_up)
p_out_down = np.array([10.20, 9.10, 7.92, 6.89, 5.87, 4.71, 3.62, 2.48, 1.65, 0.42, -0.69])
pl.plot(p_in_up,p_out_up,'bo',p_in_down,p_out_down,'rs')
pl.xlabel('Input pressure [kPa]')
pl.ylabel('Output pressure [kPa')
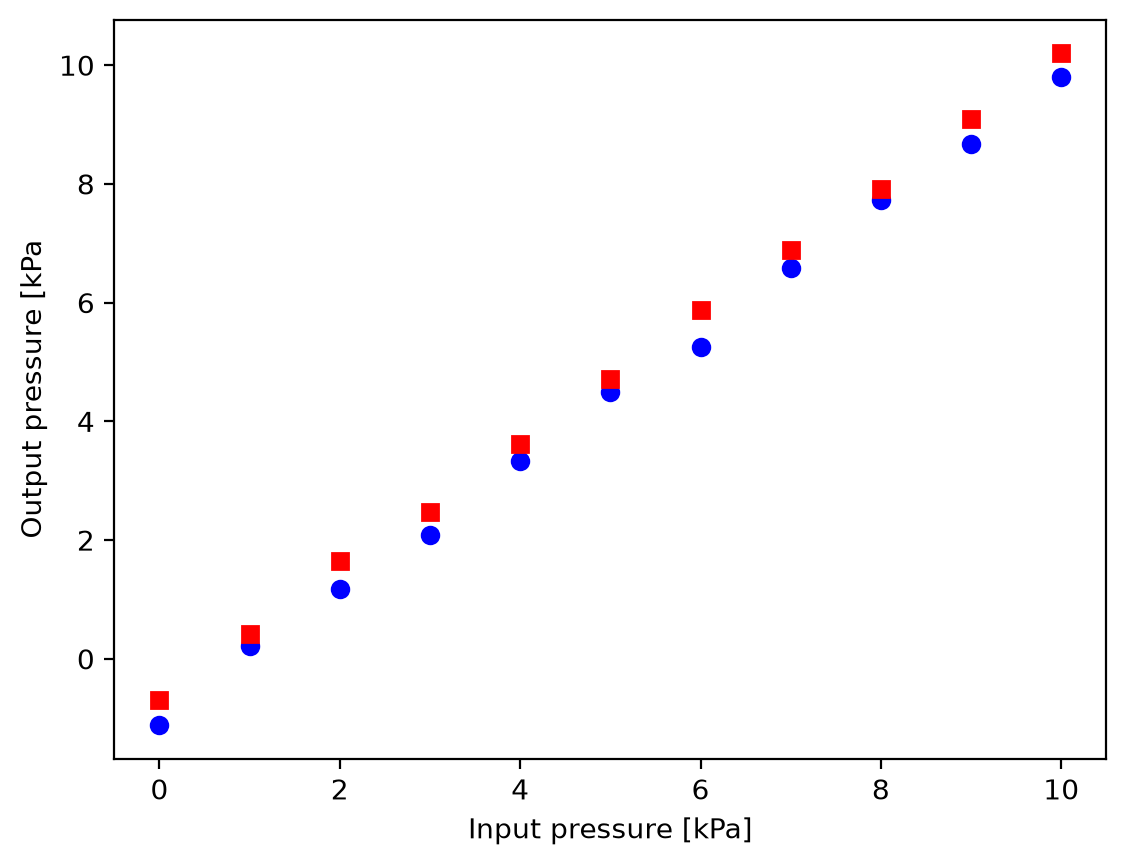
array([ 1.08231818, -0.84704545])
Estimate uncertainty
\(q_0 = m q_i + b\)
\(q_0 = 1.08 q_i + 0.85\)
\(\sigma_{q_0}^2 = \frac{1}{N} \sum (m q_i + b - q_0)\)
We then use the inverse of the calibration curve to get the inputs from the outputs:
\(q_i = \frac{q_0 - b}{m}\)
$\sigma_{q_i}^2 = \frac{1}{N} \sum \left( \frac{q_0 - b}{m} - q_i \right)^2 = \frac{\sigma_{q_0}^2}{m^2} $
m = 1.08
b = -0.85
std_q0 = np.sqrt(1.0 / (y.size - 1) * np.sum((m * x_1 + b - y) ** 2))
print('std(q_0) = %f ' % std_q0)
std(q_0) = 0.203727
# let's assume we measured output
q_0 = 4.32 #kPa
# we estimate the real input as:
q_i = (q_0 - b)/m

# and its std. dev.

std_qi = std_q0/m

print ('q_i = %3.2f +- %3.2f kPa ' % (q_i, 3*std_qi))
q_i = 4.79 +- 0.57 kPa
Uncertainties of least-square best fit estimates:
$S_y^2 = \frac{1}{N-1} \sum\limits_{i=1}^N (y_i - \overline{y})^2 $
\(S_{yx}^2 = \frac{1}{\nu} \sum\limits_{i=1}^N (y_i - \overline{y_{c_i}})^2\)
\(\nu = N - (m+1)\)
$S_m = S_{yx}^2 \frac{N}{N\sum\limits_{i=1}^N x_i^2 - \left( \sum\limits_{i=1}^N x_i \right)^2} $
$S_b = S_{yx}^2 \frac{N\sum\limits_{i=1}^N x_i^2}{N \left[N\sum\limits_{i=1}^N x_i^2 - \left( \sum\limits_{i=1}^N x_i \right)^2 \right]} $
\(S_m = 0.0134\) - sensitivity uncertainty
\(S_b = 0.078\) - zero shift uncertainty
$ m = 1.08 \pm 0.04$
$ b = -0.85 \pm 0.24 $ kPa