Propagating uncertainty using Monte-Carlo simulations
The analytical law of propagation (RSS with sensitivity coefficients) has three limits:
- It is exact only for linear measurement functions.
- It assumes the output is normally distributed.
- Complex models invite algebra mistakes when combining terms.
Monte-Carlo (MC) propagation skips the algebra: draw many random input sets from their
distributions, push each through \(y = f(x)\), and read the output distribution directly —
mean, standard deviation, and any coverage interval.
import numpy as np
import matplotlib.pyplot as plt
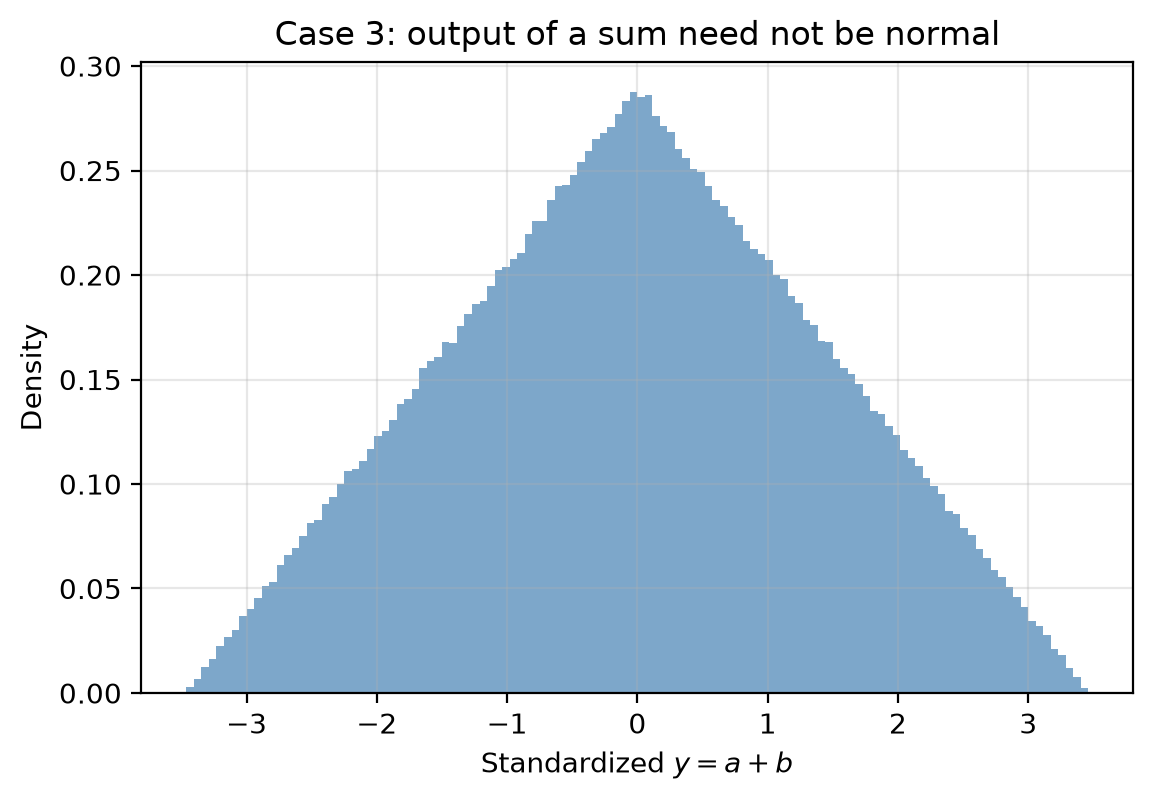
Interactive: what does \(y = a + b\) look like?
Even the simplest sum produces different output shapes depending on the inputs.
Drag the slider through the 6 cases (\(10^6\) trials each, seed 42):
- normal + normal, equal size → normal output
- normal + wider normal → still normal, wider
- uniform + uniform, equal size → triangular output
- uniform + wider uniform → complex (trapezoidal) output
- normal + uniform → complex output, hard to predict
- normal + wider uniform → complex output
How simulation works
- Define the measurement function \(y = f(x)\), with \(x\) a vector of influence quantities.
- Draw \(m\) random input sets from each input's distribution (normal, rectangular, …).
- Push every set through \(f\): \(Y = f(X)\).
- Read the output: mean, standard deviation, and percentiles for the coverage interval
(e.g. 2.5th/97.5th for 95%).
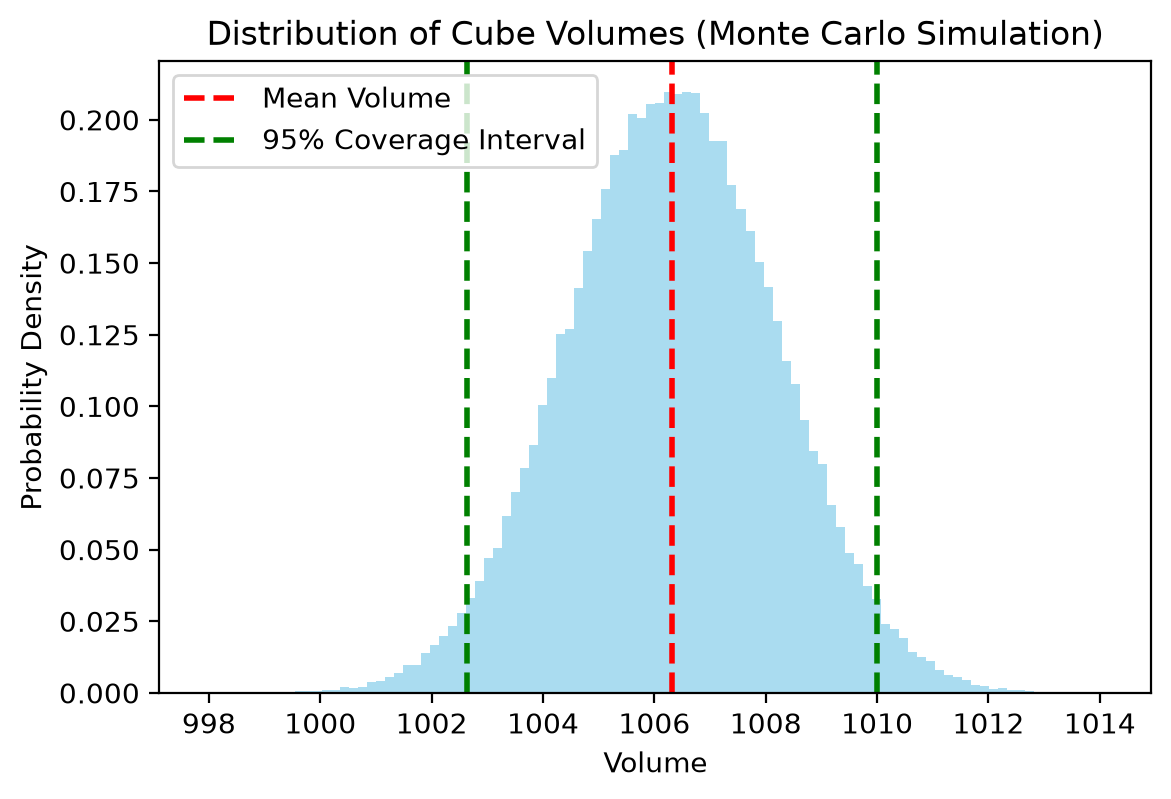
Example 1: non-linear propagation — cube volume \(V = h^3\)
def monte_carlo_cube_volume(measurements, resolution, num_simulations=100000):
    # Calculate mean and standard deviation of measurements
    mean_height = np.mean(measurements)
    std_height = np.std(measurements, ddof=1)

    # Type B uncertainty (assuming rectangular distribution for resolution)
    u_b = resolution / np.sqrt(3)

    # Combine Type A and Type B uncertainties
    u_c = np.sqrt((std_height / np.sqrt(len(measurements)))**2 + u_b**2)

    # Generate Monte Carlo simulations
    simulated_heights = np.random.normal(mean_height, u_c, num_simulations)

    # Calculate volumes
    simulated_volumes = simulated_heights**3

    # Calculate results
    mean_volume = np.mean(simulated_volumes)
    std_volume = np.std(simulated_volumes)

    # Calculate coverage interval (95%)
    coverage_interval = np.percentile(simulated_volumes, [2.5, 97.5])

    print(f"Mean height: {mean_height:.6f}")
    print(f"Combined standard uncertainty of height: {u_c:.6f}")
    print(f"Mean volume: {mean_volume:.6f}")
    print(f"Standard uncertainty of volume: {std_volume:.6f}")
    print(f"95% coverage interval for volume: [{coverage_interval[0]:.6f}, {coverage_interval[1]:.6f}]")

    # Plot histogram of simulated volumes
    plt.figure(figsize=(6.4, 4.1))
    plt.hist(simulated_volumes, bins=100, density=True, alpha=0.7, color='skyblue')
    plt.axvline(mean_volume, color='red', linestyle='dashed', linewidth=2, label='Mean Volume')
    plt.axvline(coverage_interval[0], color='green', linestyle='dashed', linewidth=2, label='95% Coverage Interval')
    plt.axvline(coverage_interval[1], color='green', linestyle='dashed', linewidth=2)
    plt.xlabel('Volume')
    plt.ylabel('Probability Density')
    plt.title('Distribution of Cube Volumes (Monte Carlo Simulation)')
    plt.legend()
    plt.show()
# Example usage
height_measurements = [10.02, 10.03, 10.01, 10.02, 10.03, 10.02, 10.01, 10.02, 10.03, 10.02]
resolution = 0.01  # mm
monte_carlo_cube_volume(height_measurements, resolution)
Mean height: 10.021000
Combined standard uncertainty of height: 0.006227
Mean volume: 1006.315075
Standard uncertainty of volume: 1.880801
95% coverage interval for volume: [1002.626877, 1009.989970]
Example 2: thermal expansion — where first-order theory falls short
Measurement model: \(\Delta L = L \cdot \Delta T \cdot \alpha\).
First-order propagation gives
\(u^2(\Delta L) = (\Delta T\alpha)^2u^2(L) + (L\alpha)^2u^2(\Delta T) + (L\Delta T)^2u^2(\alpha)\),
but the exact expansion adds higher-order products such as
\(\Delta T\,u^2(L)u^2(\alpha)\) and \(u^2(\Delta T)u^2(L)u^2(\alpha)\).
A \(10^6\)-trial simulation of \((L, \Delta T, \alpha)\) needs none of that algebra and
stays correct where the first-order approximation drifts — especially at 99.9%
coverage, where the simulated range runs almost twice the first-order prediction.
Example 3: cosine error — a non-normal output
A 200 mm length measured with 2 µm length uncertainty and 1° alignment uncertainty
produces a visibly non-normal output distribution. Theory and simulation agree on the
standard uncertainty but disagree on the confidence limits — and the gap grows with
the confidence level. This is exactly the case simulation exists for.
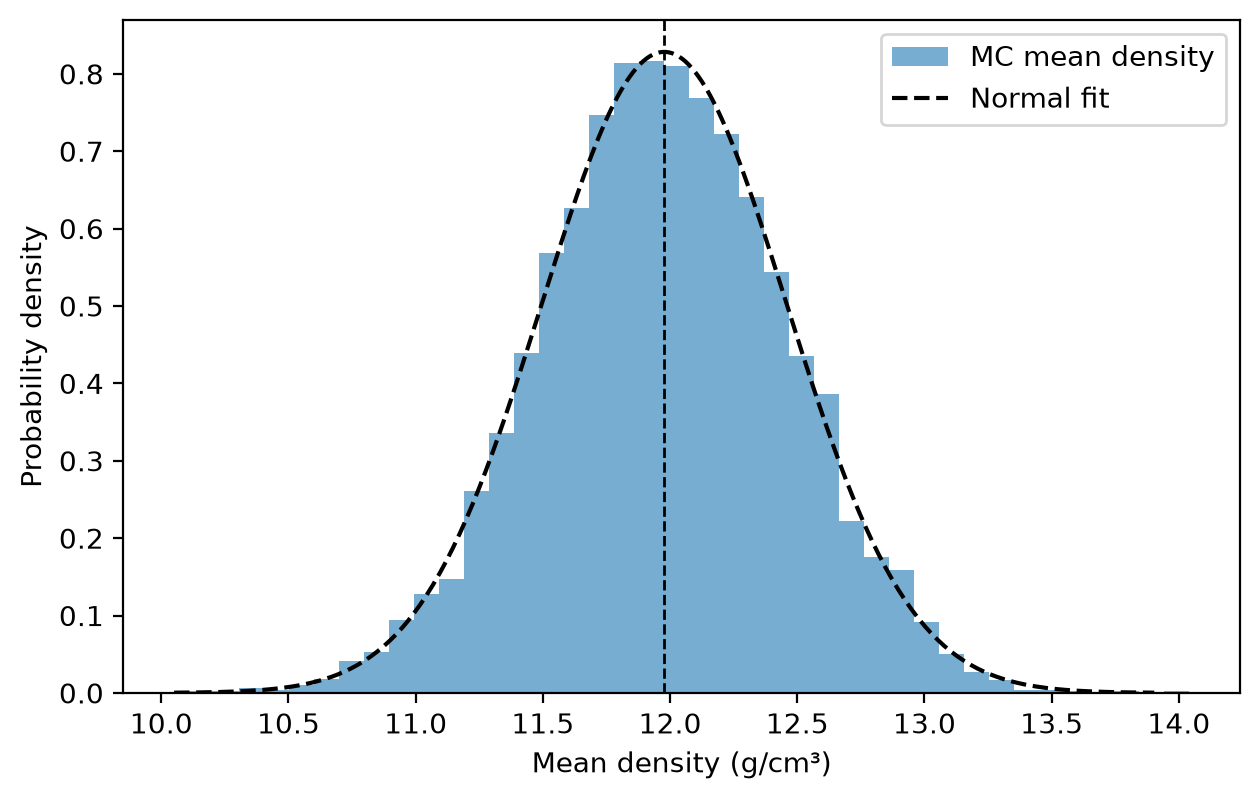
Example 4: real data — density from caliper, micrometer, and balance
Diameter (caliper, res 0.01 mm), height (micrometer, res 0.001 mm), and mass
(balance, \(u = 0.1\) g) combine into density. Analytical relative propagation and a
5000-trial MC of the mean density agree — run both and compare.
Mean density = 11.9769 ± 0.4816 g/cm^3 (1σ, MC of the mean)
Best practices for simulation
- Trials: use at least \(10^6\) trials; more for high confidence levels; check
convergence by increasing the count.
- Distributions: match actual measurement conditions and document every assumption.
- Validation: compare against the analytical result where one exists, and check
sensitivity to input parameters.
- Documentation: record trial count, distributions, and confidence level with the result.
{"var_name":"mc_case","kind":"slider","values":[1,2,3,4,5,6],"default":3,"label":"Input combination case (y = a + b)"}
{"1":{"4":"\u003cdiv class=\"marimo-book-output\"\u003e\n\u003cmarimo-slider data-initial-value='1' data-label='\u0026quot;\u0026#92;u003cspan class=\u0026#92;\u0026quot;markdown prose dark:prose-invert contents\u0026#92;\u0026quot;\u0026#92;u003e\u0026#92;u003cspan class=\u0026#92;\u0026quot;paragraph\u0026#92;\u0026quot;\u0026#92;u003eInput combination case (y = a + b)\u0026#92;u003c/span\u0026#92;u003e\u0026#92;u003c/span\u0026#92;u003e\u0026quot;' data-start='1' data-stop='6' data-step='1' data-steps='[]' data-debounce='false' data-disabled='false' data-orientation='\u0026quot;horizontal\u0026quot;' data-show-value='false' data-include-input='false' data-full-width='false'\u003e\u003c/marimo-slider\u003e\n\u003c/div\u003e","5":"\u003cdiv class=\"marimo-book-output\"\u003e\u003cimg src=\"../assets/img/783056a2c714b45dd355b5cb44d62e15280054f5ef232b3b4a879d99e0b962b6.webp\" loading=\"lazy\" decoding=\"async\" width=\"1153\" height=\"800\" /\u003e\u003c/div\u003e","8":"\u003cdiv class=\"language-python highlight\"\u003e\u003cpre\u003e\u003cspan\u003e\u003c/span\u003e\u003ccode\u003e\u003cspan id=\"__span-0-1\"\u003e\u003ca id=\"__codelineno-0-1\" name=\"__codelineno-0-1\" href=\"#__codelineno-0-1\"\u003e\u003c/a\u003e\u003cspan class=\"c1\"\u003e# Example usage\u003c/span\u003e\n\u003c/span\u003e\u003cspan id=\"__span-0-2\"\u003e\u003ca id=\"__codelineno-0-2\" name=\"__codelineno-0-2\" href=\"#__codelineno-0-2\"\u003e\u003c/a\u003e\u003cspan class=\"n\"\u003eheight_measurements\u003c/span\u003e \u003cspan class=\"o\"\u003e=\u003c/span\u003e \u003cspan class=\"p\"\u003e[\u003c/span\u003e\u003cspan class=\"mf\"\u003e10.02\u003c/span\u003e\u003cspan class=\"p\"\u003e,\u003c/span\u003e \u003cspan class=\"mf\"\u003e10.03\u003c/span\u003e\u003cspan class=\"p\"\u003e,\u003c/span\u003e \u003cspan class=\"mf\"\u003e10.01\u003c/span\u003e\u003cspan class=\"p\"\u003e,\u003c/span\u003e \u003cspan class=\"mf\"\u003e10.02\u003c/span\u003e\u003cspan class=\"p\"\u003e,\u003c/span\u003e \u003cspan class=\"mf\"\u003e10.03\u003c/span\u003e\u003cspan class=\"p\"\u003e,\u003c/span\u003e \u003cspan class=\"mf\"\u003e10.02\u003c/span\u003e\u003cspan class=\"p\"\u003e,\u003c/span\u003e \u003cspan class=\"mf\"\u003e10.01\u003c/span\u003e\u003cspan class=\"p\"\u003e,\u003c/span\u003e \u003cspan class=\"mf\"\u003e10.02\u003c/span\u003e\u003cspan class=\"p\"\u003e,\u003c/span\u003e \u003cspan class=\"mf\"\u003e10.03\u003c/span\u003e\u003cspan class=\"p\"\u003e,\u003c/span\u003e \u003cspan class=\"mf\"\u003e10.02\u003c/span\u003e\u003cspan class=\"p\"\u003e]\u003c/span\u003e\n\u003c/span\u003e\u003cspan id=\"__span-0-3\"\u003e\u003ca id=\"__codelineno-0-3\" name=\"__codelineno-0-3\" href=\"#__codelineno-0-3\"\u003e\u003c/a\u003e\u003cspan class=\"n\"\u003eresolution\u003c/span\u003e \u003cspan class=\"o\"\u003e=\u003c/span\u003e \u003cspan class=\"mf\"\u003e0.01\u003c/span\u003e \u003cspan class=\"c1\"\u003e# mm\u003c/span\u003e\n\u003c/span\u003e\u003cspan id=\"__span-0-4\"\u003e\u003ca id=\"__codelineno-0-4\" name=\"__codelineno-0-4\" href=\"#__codelineno-0-4\"\u003e\u003c/a\u003e\u003cspan class=\"n\"\u003emonte_carlo_cube_volume\u003c/span\u003e\u003cspan class=\"p\"\u003e(\u003c/span\u003e\u003cspan class=\"n\"\u003eheight_measurements\u003c/span\u003e\u003cspan class=\"p\"\u003e,\u003c/span\u003e \u003cspan class=\"n\"\u003eresolution\u003c/span\u003e\u003cspan class=\"p\"\u003e)\u003c/span\u003e\n\u003c/span\u003e\u003c/code\u003e\u003c/pre\u003e\u003c/div\u003e\n\u003cpre class=\"marimo-book-output-text marimo-stream-stdout\"\u003eMean height: 10.021000\nCombined standard uncertainty of height: 0.006227\nMean volume: 1006.310001\nStandard uncertainty of volume: 1.878857\n95% coverage interval for volume: [1002.630602, 1009.989471]\n\u003c/pre\u003e\n\n\u003cdiv class=\"marimo-book-output\"\u003e\u003cimg src=\"../assets/img/f7d0d7e97003f7559c4552c6dfd8555a7c90224e8e52afdbf8e0843cc134c633.webp\" loading=\"lazy\" decoding=\"async\" width=\"1171\" height=\"799\" /\u003e\u003c/div\u003e"},"2":{"4":"\u003cdiv class=\"marimo-book-output\"\u003e\n\u003cmarimo-slider data-initial-value='2' data-label='\u0026quot;\u0026#92;u003cspan class=\u0026#92;\u0026quot;markdown prose dark:prose-invert contents\u0026#92;\u0026quot;\u0026#92;u003e\u0026#92;u003cspan class=\u0026#92;\u0026quot;paragraph\u0026#92;\u0026quot;\u0026#92;u003eInput combination case (y = a + b)\u0026#92;u003c/span\u0026#92;u003e\u0026#92;u003c/span\u0026#92;u003e\u0026quot;' data-start='1' data-stop='6' data-step='1' data-steps='[]' data-debounce='false' data-disabled='false' data-orientation='\u0026quot;horizontal\u0026quot;' data-show-value='false' data-include-input='false' data-full-width='false'\u003e\u003c/marimo-slider\u003e\n\u003c/div\u003e","5":"\u003cdiv class=\"marimo-book-output\"\u003e\u003cimg src=\"../assets/img/e51fec1d77a9afcb6abb572459054858dc4ed3ae1c3b0710b777a4a7ecfa1abf.webp\" loading=\"lazy\" decoding=\"async\" width=\"1171\" height=\"800\" /\u003e\u003c/div\u003e","8":"\u003cdiv class=\"language-python highlight\"\u003e\u003cpre\u003e\u003cspan\u003e\u003c/span\u003e\u003ccode\u003e\u003cspan id=\"__span-0-1\"\u003e\u003ca id=\"__codelineno-0-1\" name=\"__codelineno-0-1\" href=\"#__codelineno-0-1\"\u003e\u003c/a\u003e\u003cspan class=\"c1\"\u003e# Example usage\u003c/span\u003e\n\u003c/span\u003e\u003cspan id=\"__span-0-2\"\u003e\u003ca id=\"__codelineno-0-2\" name=\"__codelineno-0-2\" href=\"#__codelineno-0-2\"\u003e\u003c/a\u003e\u003cspan class=\"n\"\u003eheight_measurements\u003c/span\u003e \u003cspan class=\"o\"\u003e=\u003c/span\u003e \u003cspan class=\"p\"\u003e[\u003c/span\u003e\u003cspan class=\"mf\"\u003e10.02\u003c/span\u003e\u003cspan class=\"p\"\u003e,\u003c/span\u003e \u003cspan class=\"mf\"\u003e10.03\u003c/span\u003e\u003cspan class=\"p\"\u003e,\u003c/span\u003e \u003cspan class=\"mf\"\u003e10.01\u003c/span\u003e\u003cspan class=\"p\"\u003e,\u003c/span\u003e \u003cspan class=\"mf\"\u003e10.02\u003c/span\u003e\u003cspan class=\"p\"\u003e,\u003c/span\u003e \u003cspan class=\"mf\"\u003e10.03\u003c/span\u003e\u003cspan class=\"p\"\u003e,\u003c/span\u003e \u003cspan class=\"mf\"\u003e10.02\u003c/span\u003e\u003cspan class=\"p\"\u003e,\u003c/span\u003e \u003cspan class=\"mf\"\u003e10.01\u003c/span\u003e\u003cspan class=\"p\"\u003e,\u003c/span\u003e \u003cspan class=\"mf\"\u003e10.02\u003c/span\u003e\u003cspan class=\"p\"\u003e,\u003c/span\u003e \u003cspan class=\"mf\"\u003e10.03\u003c/span\u003e\u003cspan class=\"p\"\u003e,\u003c/span\u003e \u003cspan class=\"mf\"\u003e10.02\u003c/span\u003e\u003cspan class=\"p\"\u003e]\u003c/span\u003e\n\u003c/span\u003e\u003cspan id=\"__span-0-3\"\u003e\u003ca id=\"__codelineno-0-3\" name=\"__codelineno-0-3\" href=\"#__codelineno-0-3\"\u003e\u003c/a\u003e\u003cspan class=\"n\"\u003eresolution\u003c/span\u003e \u003cspan class=\"o\"\u003e=\u003c/span\u003e \u003cspan class=\"mf\"\u003e0.01\u003c/span\u003e \u003cspan class=\"c1\"\u003e# mm\u003c/span\u003e\n\u003c/span\u003e\u003cspan id=\"__span-0-4\"\u003e\u003ca id=\"__codelineno-0-4\" name=\"__codelineno-0-4\" href=\"#__codelineno-0-4\"\u003e\u003c/a\u003e\u003cspan class=\"n\"\u003emonte_carlo_cube_volume\u003c/span\u003e\u003cspan class=\"p\"\u003e(\u003c/span\u003e\u003cspan class=\"n\"\u003eheight_measurements\u003c/span\u003e\u003cspan class=\"p\"\u003e,\u003c/span\u003e \u003cspan class=\"n\"\u003eresolution\u003c/span\u003e\u003cspan class=\"p\"\u003e)\u003c/span\u003e\n\u003c/span\u003e\u003c/code\u003e\u003c/pre\u003e\u003c/div\u003e\n\u003cpre class=\"marimo-book-output-text marimo-stream-stdout\"\u003eMean height: 10.021000\nCombined standard uncertainty of height: 0.006227\nMean volume: 1006.310621\nStandard uncertainty of volume: 1.869660\n95% coverage interval for volume: [1002.647012, 1009.990363]\n\u003c/pre\u003e\n\n\u003cdiv class=\"marimo-book-output\"\u003e\u003cimg src=\"../assets/img/f87138f3d0eca81bdbca23acba00b461325ad72698716b25e650db2a90995382.webp\" loading=\"lazy\" decoding=\"async\" width=\"1153\" height=\"799\" /\u003e\u003c/div\u003e"},"4":{"4":"\u003cdiv class=\"marimo-book-output\"\u003e\n\u003cmarimo-slider data-initial-value='4' data-label='\u0026quot;\u0026#92;u003cspan class=\u0026#92;\u0026quot;markdown prose dark:prose-invert contents\u0026#92;\u0026quot;\u0026#92;u003e\u0026#92;u003cspan class=\u0026#92;\u0026quot;paragraph\u0026#92;\u0026quot;\u0026#92;u003eInput combination case (y = a + b)\u0026#92;u003c/span\u0026#92;u003e\u0026#92;u003c/span\u0026#92;u003e\u0026quot;' data-start='1' data-stop='6' data-step='1' data-steps='[]' data-debounce='false' data-disabled='false' data-orientation='\u0026quot;horizontal\u0026quot;' data-show-value='false' data-include-input='false' data-full-width='false'\u003e\u003c/marimo-slider\u003e\n\u003c/div\u003e","5":"\u003cdiv class=\"marimo-book-output\"\u003e\u003cimg src=\"../assets/img/c9500993b817f38c8ccf8d40a2efc832da2787ab3effa8f4f59a72466c7e53ee.webp\" loading=\"lazy\" decoding=\"async\" width=\"1153\" height=\"800\" /\u003e\u003c/div\u003e","8":"\u003cdiv class=\"language-python highlight\"\u003e\u003cpre\u003e\u003cspan\u003e\u003c/span\u003e\u003ccode\u003e\u003cspan id=\"__span-0-1\"\u003e\u003ca id=\"__codelineno-0-1\" name=\"__codelineno-0-1\" href=\"#__codelineno-0-1\"\u003e\u003c/a\u003e\u003cspan class=\"c1\"\u003e# Example usage\u003c/span\u003e\n\u003c/span\u003e\u003cspan id=\"__span-0-2\"\u003e\u003ca id=\"__codelineno-0-2\" name=\"__codelineno-0-2\" href=\"#__codelineno-0-2\"\u003e\u003c/a\u003e\u003cspan class=\"n\"\u003eheight_measurements\u003c/span\u003e \u003cspan class=\"o\"\u003e=\u003c/span\u003e \u003cspan class=\"p\"\u003e[\u003c/span\u003e\u003cspan class=\"mf\"\u003e10.02\u003c/span\u003e\u003cspan class=\"p\"\u003e,\u003c/span\u003e \u003cspan class=\"mf\"\u003e10.03\u003c/span\u003e\u003cspan class=\"p\"\u003e,\u003c/span\u003e \u003cspan class=\"mf\"\u003e10.01\u003c/span\u003e\u003cspan class=\"p\"\u003e,\u003c/span\u003e \u003cspan class=\"mf\"\u003e10.02\u003c/span\u003e\u003cspan class=\"p\"\u003e,\u003c/span\u003e \u003cspan class=\"mf\"\u003e10.03\u003c/span\u003e\u003cspan class=\"p\"\u003e,\u003c/span\u003e \u003cspan class=\"mf\"\u003e10.02\u003c/span\u003e\u003cspan class=\"p\"\u003e,\u003c/span\u003e \u003cspan class=\"mf\"\u003e10.01\u003c/span\u003e\u003cspan class=\"p\"\u003e,\u003c/span\u003e \u003cspan class=\"mf\"\u003e10.02\u003c/span\u003e\u003cspan class=\"p\"\u003e,\u003c/span\u003e \u003cspan class=\"mf\"\u003e10.03\u003c/span\u003e\u003cspan class=\"p\"\u003e,\u003c/span\u003e \u003cspan class=\"mf\"\u003e10.02\u003c/span\u003e\u003cspan class=\"p\"\u003e]\u003c/span\u003e\n\u003c/span\u003e\u003cspan id=\"__span-0-3\"\u003e\u003ca id=\"__codelineno-0-3\" name=\"__codelineno-0-3\" href=\"#__codelineno-0-3\"\u003e\u003c/a\u003e\u003cspan class=\"n\"\u003eresolution\u003c/span\u003e \u003cspan class=\"o\"\u003e=\u003c/span\u003e \u003cspan class=\"mf\"\u003e0.01\u003c/span\u003e \u003cspan class=\"c1\"\u003e# mm\u003c/span\u003e\n\u003c/span\u003e\u003cspan id=\"__span-0-4\"\u003e\u003ca id=\"__codelineno-0-4\" name=\"__codelineno-0-4\" href=\"#__codelineno-0-4\"\u003e\u003c/a\u003e\u003cspan class=\"n\"\u003emonte_carlo_cube_volume\u003c/span\u003e\u003cspan class=\"p\"\u003e(\u003c/span\u003e\u003cspan class=\"n\"\u003eheight_measurements\u003c/span\u003e\u003cspan class=\"p\"\u003e,\u003c/span\u003e \u003cspan class=\"n\"\u003eresolution\u003c/span\u003e\u003cspan class=\"p\"\u003e)\u003c/span\u003e\n\u003c/span\u003e\u003c/code\u003e\u003c/pre\u003e\u003c/div\u003e\n\u003cpre class=\"marimo-book-output-text marimo-stream-stdout\"\u003eMean height: 10.021000\nCombined standard uncertainty of height: 0.006227\nMean volume: 1006.310945\nStandard uncertainty of volume: 1.875967\n95% coverage interval for volume: [1002.619095, 1009.978225]\n\u003c/pre\u003e\n\n\u003cdiv class=\"marimo-book-output\"\u003e\u003cimg src=\"../assets/img/de682caac3f0873e98b0f3f94c2a06ee12bc51d321d0325a6c8b996c9d09444e.webp\" loading=\"lazy\" decoding=\"async\" width=\"1191\" height=\"799\" /\u003e\u003c/div\u003e"},"5":{"4":"\u003cdiv class=\"marimo-book-output\"\u003e\n\u003cmarimo-slider data-initial-value='5' data-label='\u0026quot;\u0026#92;u003cspan class=\u0026#92;\u0026quot;markdown prose dark:prose-invert contents\u0026#92;\u0026quot;\u0026#92;u003e\u0026#92;u003cspan class=\u0026#92;\u0026quot;paragraph\u0026#92;\u0026quot;\u0026#92;u003eInput combination case (y = a + b)\u0026#92;u003c/span\u0026#92;u003e\u0026#92;u003c/span\u0026#92;u003e\u0026quot;' data-start='1' data-stop='6' data-step='1' data-steps='[]' data-debounce='false' data-disabled='false' data-orientation='\u0026quot;horizontal\u0026quot;' data-show-value='false' data-include-input='false' data-full-width='false'\u003e\u003c/marimo-slider\u003e\n\u003c/div\u003e","5":"\u003cdiv class=\"marimo-book-output\"\u003e\u003cimg src=\"../assets/img/e2460b37d977b566c9d705bc4ba09aa7d5a21f3b132a74a498d28e2b23b4fe1e.webp\" loading=\"lazy\" decoding=\"async\" width=\"1153\" height=\"800\" /\u003e\u003c/div\u003e","8":"\u003cdiv class=\"language-python highlight\"\u003e\u003cpre\u003e\u003cspan\u003e\u003c/span\u003e\u003ccode\u003e\u003cspan id=\"__span-0-1\"\u003e\u003ca id=\"__codelineno-0-1\" name=\"__codelineno-0-1\" href=\"#__codelineno-0-1\"\u003e\u003c/a\u003e\u003cspan class=\"c1\"\u003e# Example usage\u003c/span\u003e\n\u003c/span\u003e\u003cspan id=\"__span-0-2\"\u003e\u003ca id=\"__codelineno-0-2\" name=\"__codelineno-0-2\" href=\"#__codelineno-0-2\"\u003e\u003c/a\u003e\u003cspan class=\"n\"\u003eheight_measurements\u003c/span\u003e \u003cspan class=\"o\"\u003e=\u003c/span\u003e \u003cspan class=\"p\"\u003e[\u003c/span\u003e\u003cspan class=\"mf\"\u003e10.02\u003c/span\u003e\u003cspan class=\"p\"\u003e,\u003c/span\u003e \u003cspan class=\"mf\"\u003e10.03\u003c/span\u003e\u003cspan class=\"p\"\u003e,\u003c/span\u003e \u003cspan class=\"mf\"\u003e10.01\u003c/span\u003e\u003cspan class=\"p\"\u003e,\u003c/span\u003e \u003cspan class=\"mf\"\u003e10.02\u003c/span\u003e\u003cspan class=\"p\"\u003e,\u003c/span\u003e \u003cspan class=\"mf\"\u003e10.03\u003c/span\u003e\u003cspan class=\"p\"\u003e,\u003c/span\u003e \u003cspan class=\"mf\"\u003e10.02\u003c/span\u003e\u003cspan class=\"p\"\u003e,\u003c/span\u003e \u003cspan class=\"mf\"\u003e10.01\u003c/span\u003e\u003cspan class=\"p\"\u003e,\u003c/span\u003e \u003cspan class=\"mf\"\u003e10.02\u003c/span\u003e\u003cspan class=\"p\"\u003e,\u003c/span\u003e \u003cspan class=\"mf\"\u003e10.03\u003c/span\u003e\u003cspan class=\"p\"\u003e,\u003c/span\u003e \u003cspan class=\"mf\"\u003e10.02\u003c/span\u003e\u003cspan class=\"p\"\u003e]\u003c/span\u003e\n\u003c/span\u003e\u003cspan id=\"__span-0-3\"\u003e\u003ca id=\"__codelineno-0-3\" name=\"__codelineno-0-3\" href=\"#__codelineno-0-3\"\u003e\u003c/a\u003e\u003cspan class=\"n\"\u003eresolution\u003c/span\u003e \u003cspan class=\"o\"\u003e=\u003c/span\u003e \u003cspan class=\"mf\"\u003e0.01\u003c/span\u003e \u003cspan class=\"c1\"\u003e# mm\u003c/span\u003e\n\u003c/span\u003e\u003cspan id=\"__span-0-4\"\u003e\u003ca id=\"__codelineno-0-4\" name=\"__codelineno-0-4\" href=\"#__codelineno-0-4\"\u003e\u003c/a\u003e\u003cspan class=\"n\"\u003emonte_carlo_cube_volume\u003c/span\u003e\u003cspan class=\"p\"\u003e(\u003c/span\u003e\u003cspan class=\"n\"\u003eheight_measurements\u003c/span\u003e\u003cspan class=\"p\"\u003e,\u003c/span\u003e \u003cspan class=\"n\"\u003eresolution\u003c/span\u003e\u003cspan class=\"p\"\u003e)\u003c/span\u003e\n\u003c/span\u003e\u003c/code\u003e\u003c/pre\u003e\u003c/div\u003e\n\u003cpre class=\"marimo-book-output-text marimo-stream-stdout\"\u003eMean height: 10.021000\nCombined standard uncertainty of height: 0.006227\nMean volume: 1006.318675\nStandard uncertainty of volume: 1.878356\n95% coverage interval for volume: [1002.635348, 1010.003893]\n\u003c/pre\u003e\n\n\u003cdiv class=\"marimo-book-output\"\u003e\u003cimg src=\"../assets/img/9bf50082d0d4ebbd6eb5e90ab51040cd08ff43983866ef924ebbf849a674e4a0.webp\" loading=\"lazy\" decoding=\"async\" width=\"1169\" height=\"799\" /\u003e\u003c/div\u003e"},"6":{"4":"\u003cdiv class=\"marimo-book-output\"\u003e\n\u003cmarimo-slider data-initial-value='6' data-label='\u0026quot;\u0026#92;u003cspan class=\u0026#92;\u0026quot;markdown prose dark:prose-invert contents\u0026#92;\u0026quot;\u0026#92;u003e\u0026#92;u003cspan class=\u0026#92;\u0026quot;paragraph\u0026#92;\u0026quot;\u0026#92;u003eInput combination case (y = a + b)\u0026#92;u003c/span\u0026#92;u003e\u0026#92;u003c/span\u0026#92;u003e\u0026quot;' data-start='1' data-stop='6' data-step='1' data-steps='[]' data-debounce='false' data-disabled='false' data-orientation='\u0026quot;horizontal\u0026quot;' data-show-value='false' data-include-input='false' data-full-width='false'\u003e\u003c/marimo-slider\u003e\n\u003c/div\u003e","5":"\u003cdiv class=\"marimo-book-output\"\u003e\u003cimg src=\"../assets/img/94ba30f99abbb871f3c48091bde45eb69a2ed364dd6dfb98a0a9ca6a037cc75d.webp\" loading=\"lazy\" decoding=\"async\" width=\"1153\" height=\"800\" /\u003e\u003c/div\u003e","8":"\u003cdiv class=\"language-python highlight\"\u003e\u003cpre\u003e\u003cspan\u003e\u003c/span\u003e\u003ccode\u003e\u003cspan id=\"__span-0-1\"\u003e\u003ca id=\"__codelineno-0-1\" name=\"__codelineno-0-1\" href=\"#__codelineno-0-1\"\u003e\u003c/a\u003e\u003cspan class=\"c1\"\u003e# Example usage\u003c/span\u003e\n\u003c/span\u003e\u003cspan id=\"__span-0-2\"\u003e\u003ca id=\"__codelineno-0-2\" name=\"__codelineno-0-2\" href=\"#__codelineno-0-2\"\u003e\u003c/a\u003e\u003cspan class=\"n\"\u003eheight_measurements\u003c/span\u003e \u003cspan class=\"o\"\u003e=\u003c/span\u003e \u003cspan class=\"p\"\u003e[\u003c/span\u003e\u003cspan class=\"mf\"\u003e10.02\u003c/span\u003e\u003cspan class=\"p\"\u003e,\u003c/span\u003e \u003cspan class=\"mf\"\u003e10.03\u003c/span\u003e\u003cspan class=\"p\"\u003e,\u003c/span\u003e \u003cspan class=\"mf\"\u003e10.01\u003c/span\u003e\u003cspan class=\"p\"\u003e,\u003c/span\u003e \u003cspan class=\"mf\"\u003e10.02\u003c/span\u003e\u003cspan class=\"p\"\u003e,\u003c/span\u003e \u003cspan class=\"mf\"\u003e10.03\u003c/span\u003e\u003cspan class=\"p\"\u003e,\u003c/span\u003e \u003cspan class=\"mf\"\u003e10.02\u003c/span\u003e\u003cspan class=\"p\"\u003e,\u003c/span\u003e \u003cspan class=\"mf\"\u003e10.01\u003c/span\u003e\u003cspan class=\"p\"\u003e,\u003c/span\u003e \u003cspan class=\"mf\"\u003e10.02\u003c/span\u003e\u003cspan class=\"p\"\u003e,\u003c/span\u003e \u003cspan class=\"mf\"\u003e10.03\u003c/span\u003e\u003cspan class=\"p\"\u003e,\u003c/span\u003e \u003cspan class=\"mf\"\u003e10.02\u003c/span\u003e\u003cspan class=\"p\"\u003e]\u003c/span\u003e\n\u003c/span\u003e\u003cspan id=\"__span-0-3\"\u003e\u003ca id=\"__codelineno-0-3\" name=\"__codelineno-0-3\" href=\"#__codelineno-0-3\"\u003e\u003c/a\u003e\u003cspan class=\"n\"\u003eresolution\u003c/span\u003e \u003cspan class=\"o\"\u003e=\u003c/span\u003e \u003cspan class=\"mf\"\u003e0.01\u003c/span\u003e \u003cspan class=\"c1\"\u003e# mm\u003c/span\u003e\n\u003c/span\u003e\u003cspan id=\"__span-0-4\"\u003e\u003ca id=\"__codelineno-0-4\" name=\"__codelineno-0-4\" href=\"#__codelineno-0-4\"\u003e\u003c/a\u003e\u003cspan class=\"n\"\u003emonte_carlo_cube_volume\u003c/span\u003e\u003cspan class=\"p\"\u003e(\u003c/span\u003e\u003cspan class=\"n\"\u003eheight_measurements\u003c/span\u003e\u003cspan class=\"p\"\u003e,\u003c/span\u003e \u003cspan class=\"n\"\u003eresolution\u003c/span\u003e\u003cspan class=\"p\"\u003e)\u003c/span\u003e\n\u003c/span\u003e\u003c/code\u003e\u003c/pre\u003e\u003c/div\u003e\n\u003cpre class=\"marimo-book-output-text marimo-stream-stdout\"\u003eMean height: 10.021000\nCombined standard uncertainty of height: 0.006227\nMean volume: 1006.313049\nStandard uncertainty of volume: 1.872486\n95% coverage interval for volume: [1002.650000, 1009.980569]\n\u003c/pre\u003e\n\n\u003cdiv class=\"marimo-book-output\"\u003e\u003cimg src=\"../assets/img/9e612c8e7e0b1baca5c09013bd77e1745874304b3fce4febb5af502751794e21.webp\" loading=\"lazy\" decoding=\"async\" width=\"1184\" height=\"799\" /\u003e\u003c/div\u003e"}}