Chi-square Test
Lecture 5 - probability and statistics
In this notebook we will collect all the examples from Lecture 5 ``Probability and statistics''
Chi-square Test
Histogram
import numpy as np                   # numerical stuff
from matplotlib import pyplot as plt # plotting functions
plt.style.use('fivethirtyeight')
# create histogram using matplotlib and store the histogram output
x_modes = plt.hist(x) #note that we did not specify number of bins
# the output in x_modes

# which bin has most samples?
x_mode_ind = np.argmax(x_modes[0])

# how many counts in the top column?
x_mode_count = x_modes[0][x_mode_ind]

# what is the value of most frequent sample:
x_mode_val = x[x_mode_ind]

print(f"Data: {x}")
print(f"Mean: {np.mean(x):.2f}, Median: {np.median(x):.2f} STD: {np.std(x):.2f}")
print(f"Mode: {x_mode_val} appears {x_mode_count} times" )
Data: [12.1 12.3 12.2 12.2 12.4 12.3 12.2 12.4 12.2 12.5]
Mean: 12.28, Median: 12.25 STD: 0.12
Mode: 12.2 appears 4.0 times
Let's create our own histogram
nbins = 7  # better then the default choice
hist_vals = np.zeros(nbins)
min_val = x.min() - 0.05
max_val = x.max() + 0.05
for d in x:
    bin_number = int(nbins * ((d - min_val) / (max_val - min_val)))
    hist_vals[bin_number] = hist_vals[bin_number] + 1  # for every item  # find which bin it belongs  # add a counter
# let's plot some columns
plt.bar(np.linspace(min_val,max_val,nbins),hist_vals,width = 0.05)
plt.xlim([min_val-.1,max_val+.1]);
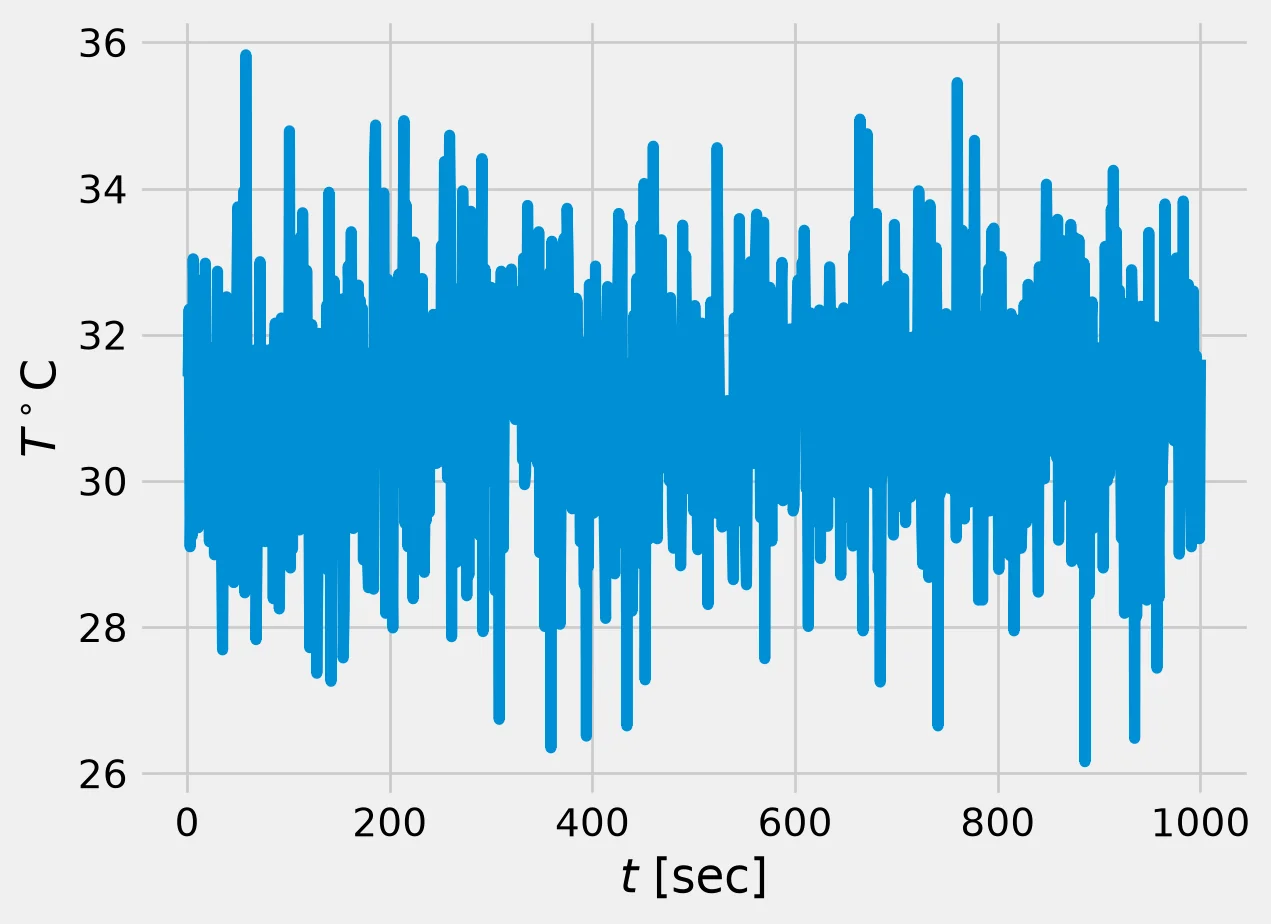
Now we can load some real long sample of turbulent temperature fluctuations
data = np.loadtxt('data/thermocouples.dat',skiprows=1)
t = data[:,0]
T = data[:,1]

# visualize the data first
plt.plot(t,T)
plt.xlabel('$t$ [sec]')
plt.ylabel(r'$T^\circ$C')
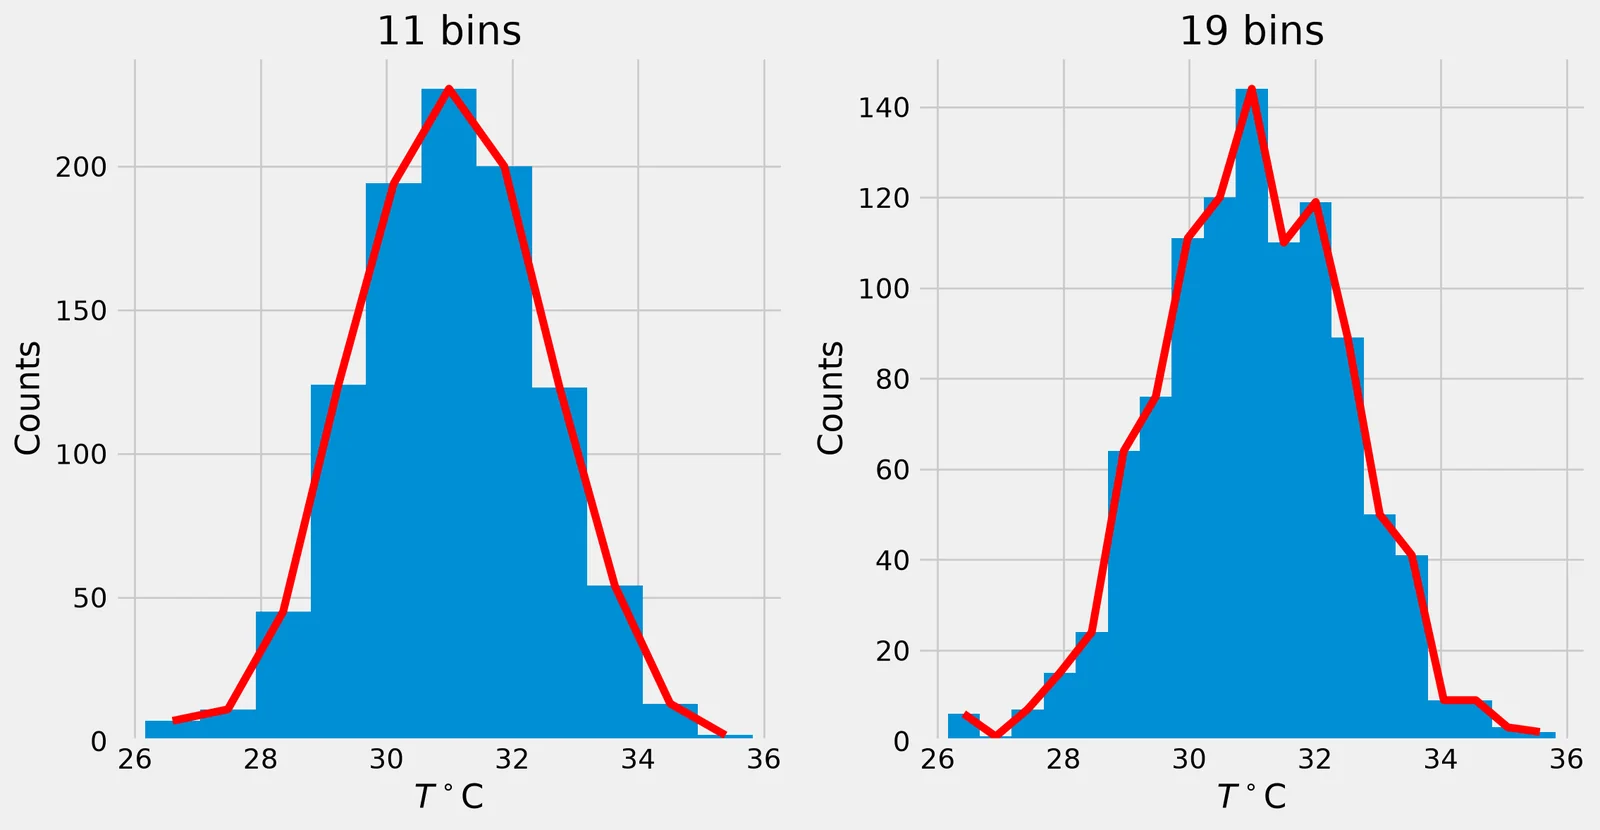
# what are the recommended number of bins, see wikipedia

# for short samples
print(f" for short samples: {int(1 + 3.3*np.log10(len(t)))}")
print(f" another rule {int(1.87*(len(t)-1)**(0.4))}")

# for long samples
print(f" for long samples: {int(2*len(t)**(0.33))}")
print(f" for very long ones: {int(np.sqrt(len(t)))}")
 for short samples: 10
 another rule 29
 for long samples: 19
 for very long ones: 31
_J = 11
fig, ax = plt.subplots(1, 2, figsize=(12, 6))
n, bins, _patches = ax[0].hist(T, _J)
x_1 = bins[:-1] + 0.5 * np.diff(bins)[0]
ax[0].plot(x_1, n, 'r')
ax[0].set_xlabel('$T^\\circ$C')
ax[0].set_ylabel('Counts')
ax[0].set_title('11 bins')
_J = 19
n, bins, _patches = ax[1].hist(T, _J)
x_1 = bins[:-1] + 0.5 * np.diff(bins)[0]
ax[1].plot(x_1, n, 'r')
ax[1].set_xlabel('$T^\\circ$C')
ax[1].set_ylabel('Counts')
ax[1].set_title('19 bins')
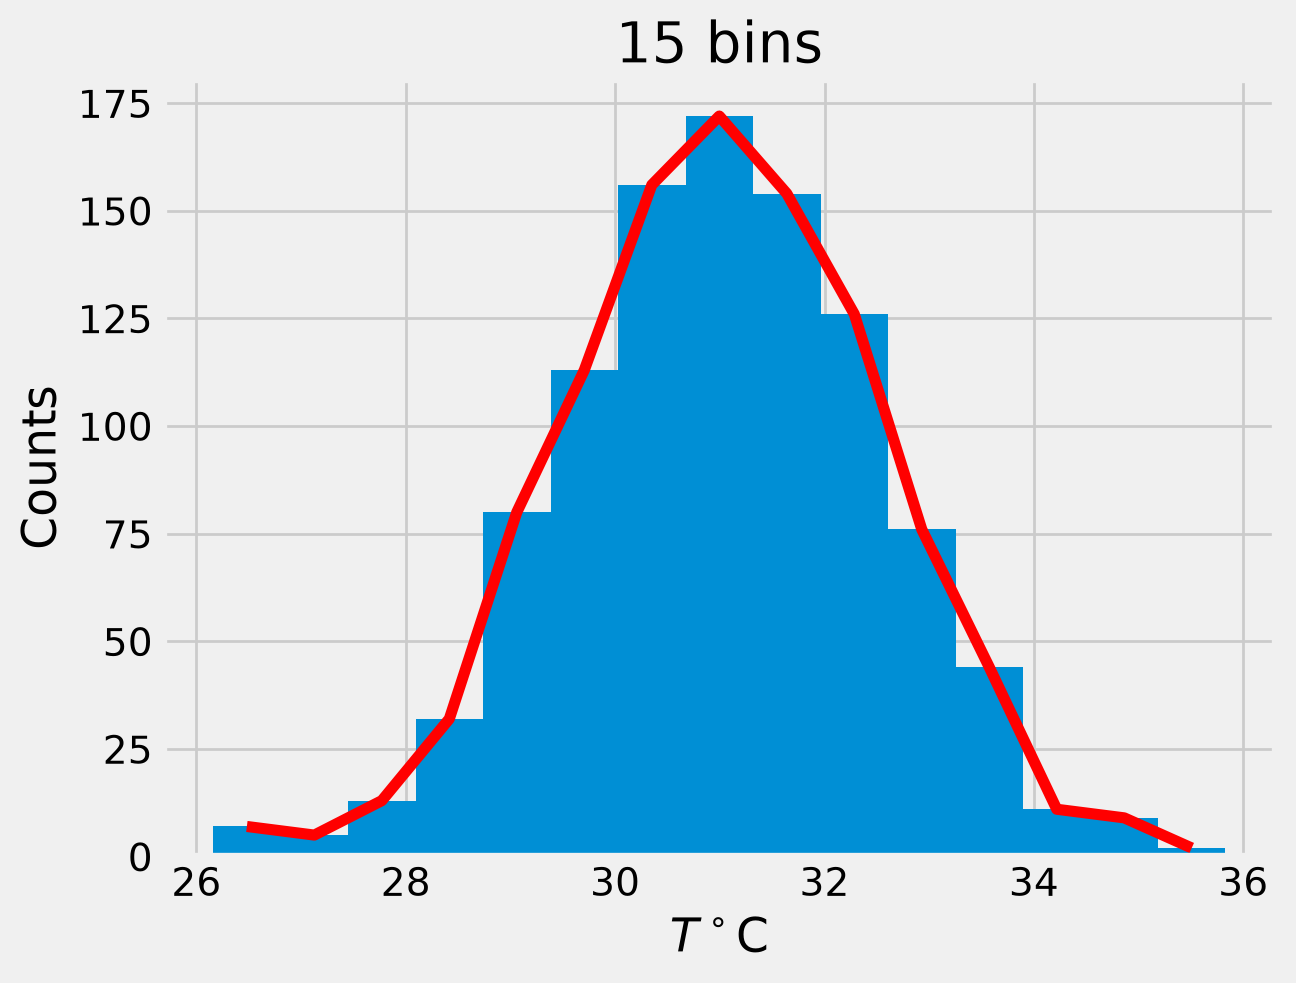
_J = 15
n_1, bins_1, _patches = plt.hist(T, _J)
x_2 = bins_1[:-1] + 0.5 * np.diff(bins_1)[0]
plt.plot(x_2, n_1, 'r')
plt.xlabel('$T^\\circ$C')
plt.ylabel('Counts')
plt.title('15 bins')
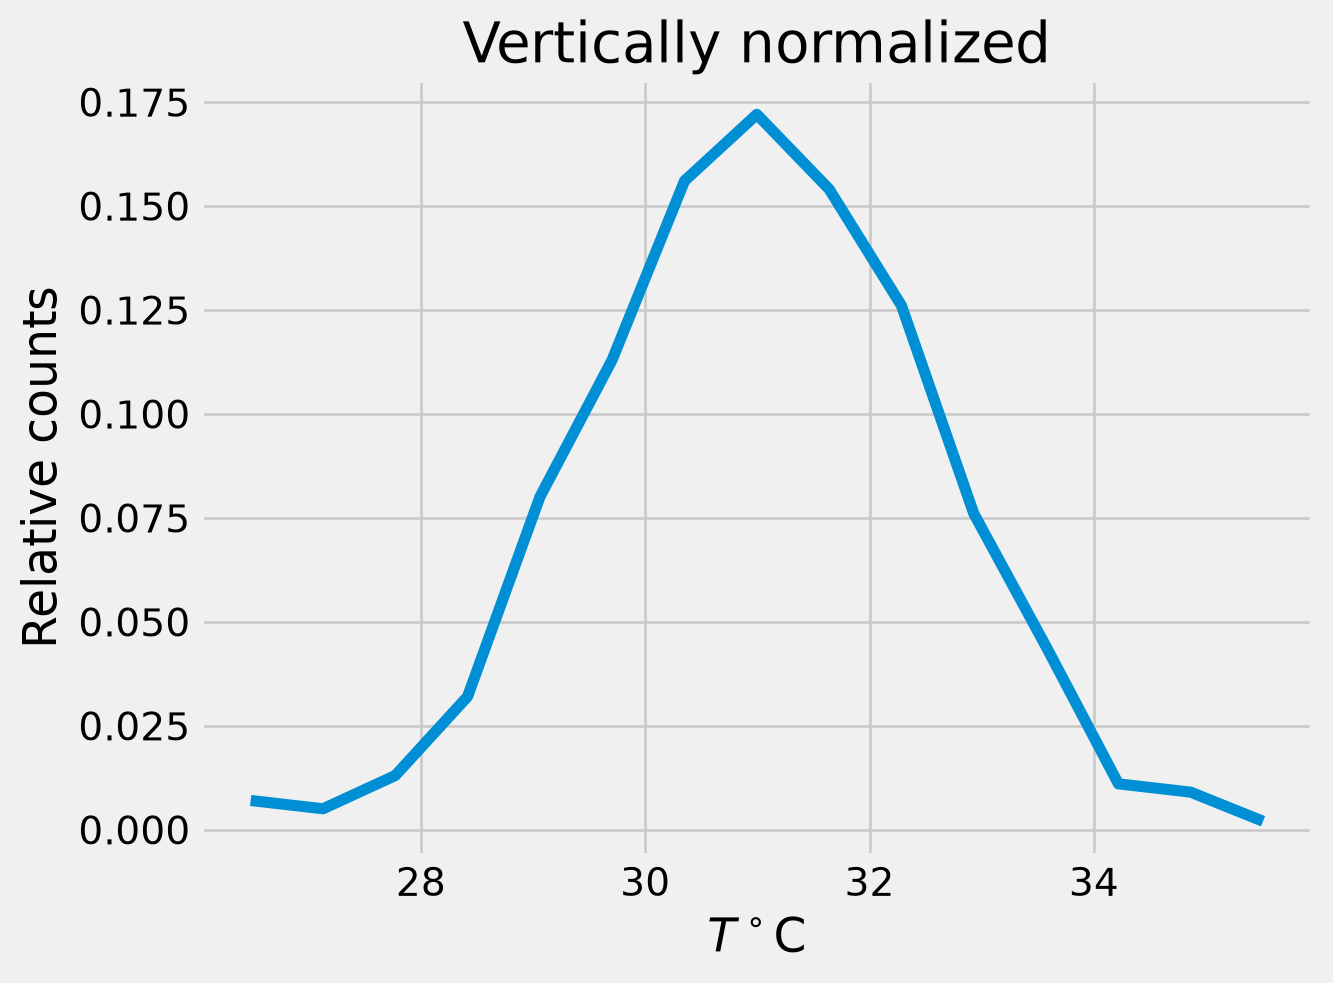
# vertical normalization
p = n_1 / 1000.0  # data.shape[0]
plt.plot(x_2, p)
plt.xlabel('$T^\\circ$C')
plt.ylabel('Relative counts')
plt.title('Vertically normalized')
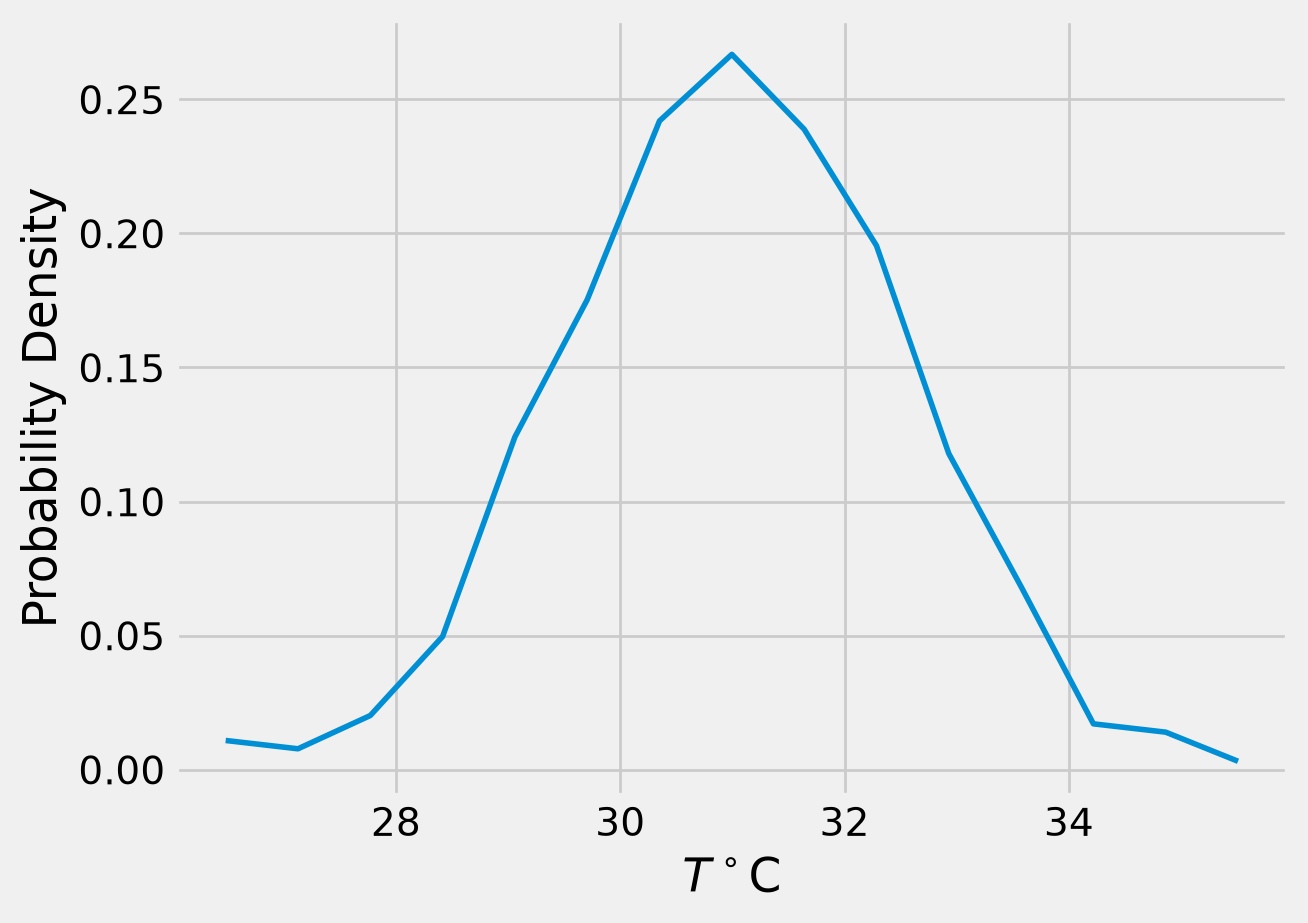
# area normalization
f = p / np.diff(x_2)[0]
plt.plot(x_2, f, lw=2)
plt.xlabel('$T^\\circ$C')
plt.ylabel('Probability Density')
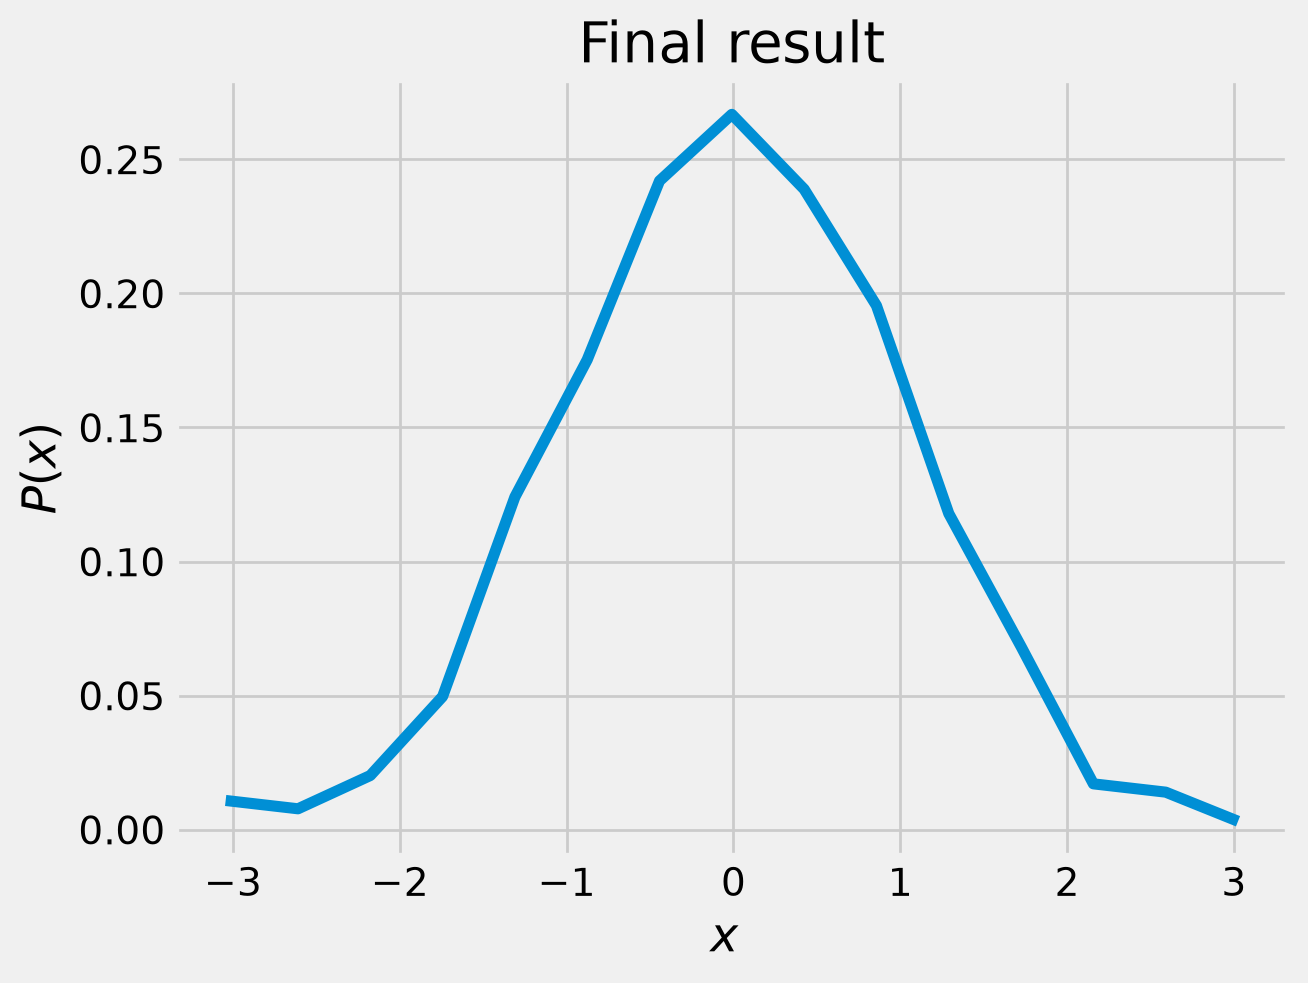
# horizontal normalization, transfer to Gaussian z
z = (x_2 - T.mean()) / T.std()
plt.plot(z, f)
plt.xlabel('$x$ ')
plt.ylabel('$P(x)$')
plt.title('Final result')
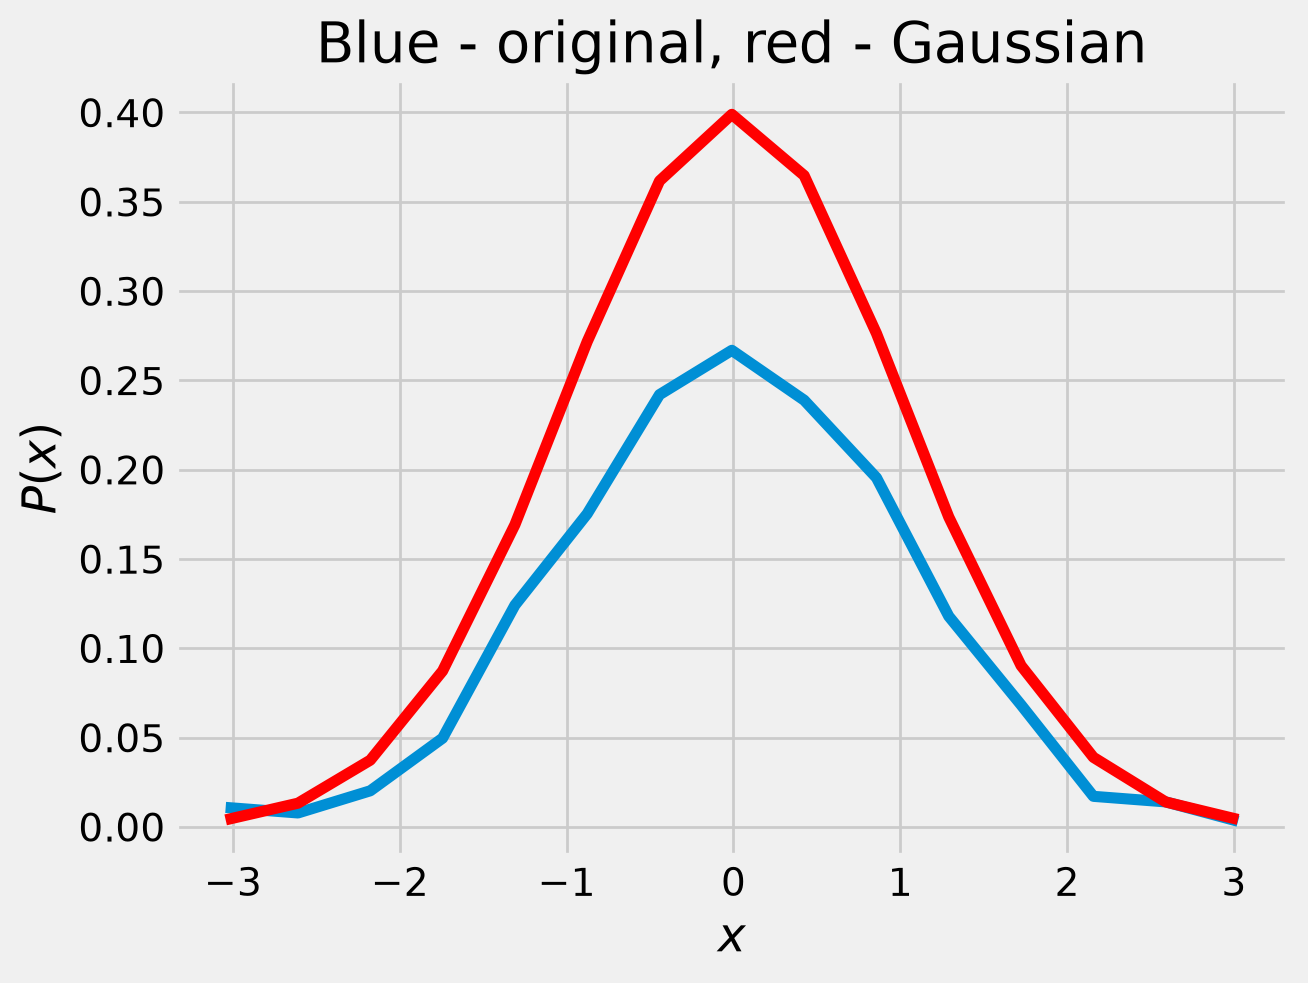
def gaussian(x,mu,sig):
    return 1/(sig*np.sqrt(2*np.pi))*np.exp(-((x-mu)**2)/(2*sig**2))

plt.plot(z,f,z,gaussian(z,0,1),'r')
plt.xlabel(r'$x$')
plt.ylabel(r'$P(x)$')
plt.title('Blue - original, red - Gaussian')
import scipy.stats as st

print(("T skewness = %.3f, kurtosis = %.3f" % (st.skew(T), st.kurtosis(T))))
tmp = np.random.randn(1000)
print(("Normal distribution skewness = %.3f, kurtosis = %.3f" % (st.skew(tmp), st.kurtosis(tmp))))
T skewness = -0.069, kurtosis = 0.079
Normal distribution skewness = -0.050, kurtosis = -0.058
Area under the curve = 0.995500
Chi-square test
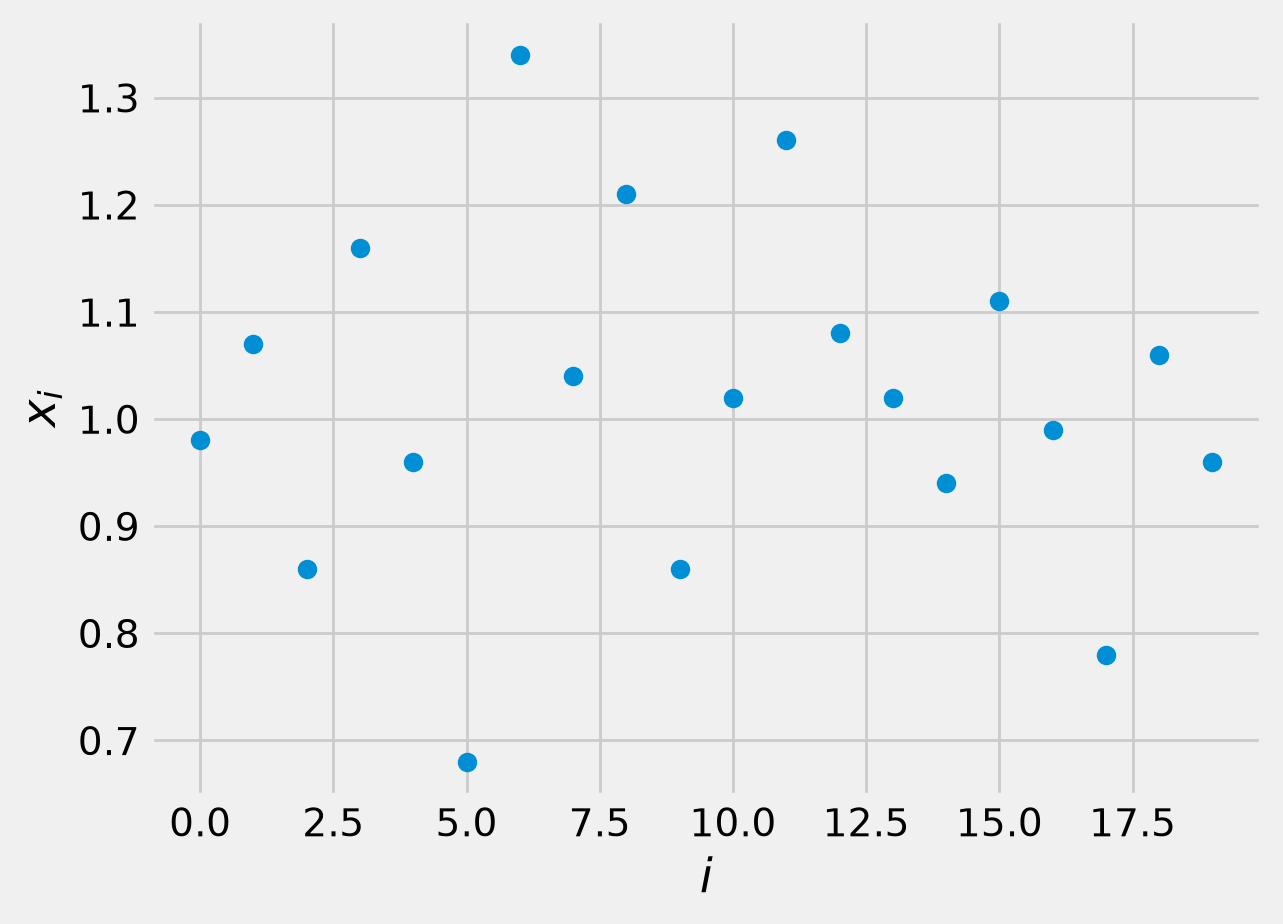
How well does a set of measurements follow an assumed distribution function?
data_1 = np.array([0.98, 1.07, 0.86, 1.16, 0.96, 0.68, 1.34, 1.04, 1.21, 0.86, 1.02, 1.26, 1.08, 1.02, 0.94, 1.11, 0.99, 0.78, 1.06, 0.96])
- 0: 1.0190000000000001
- 1: 0.15368474224853942
- 2: 20
- 3: 0.68
- 4: 1.34
n_2 = data_1.shape[0]
K = int(1.87 * (n_2 - 1) ** 0.4 + 1)
print(f'best number of bins is {K}')
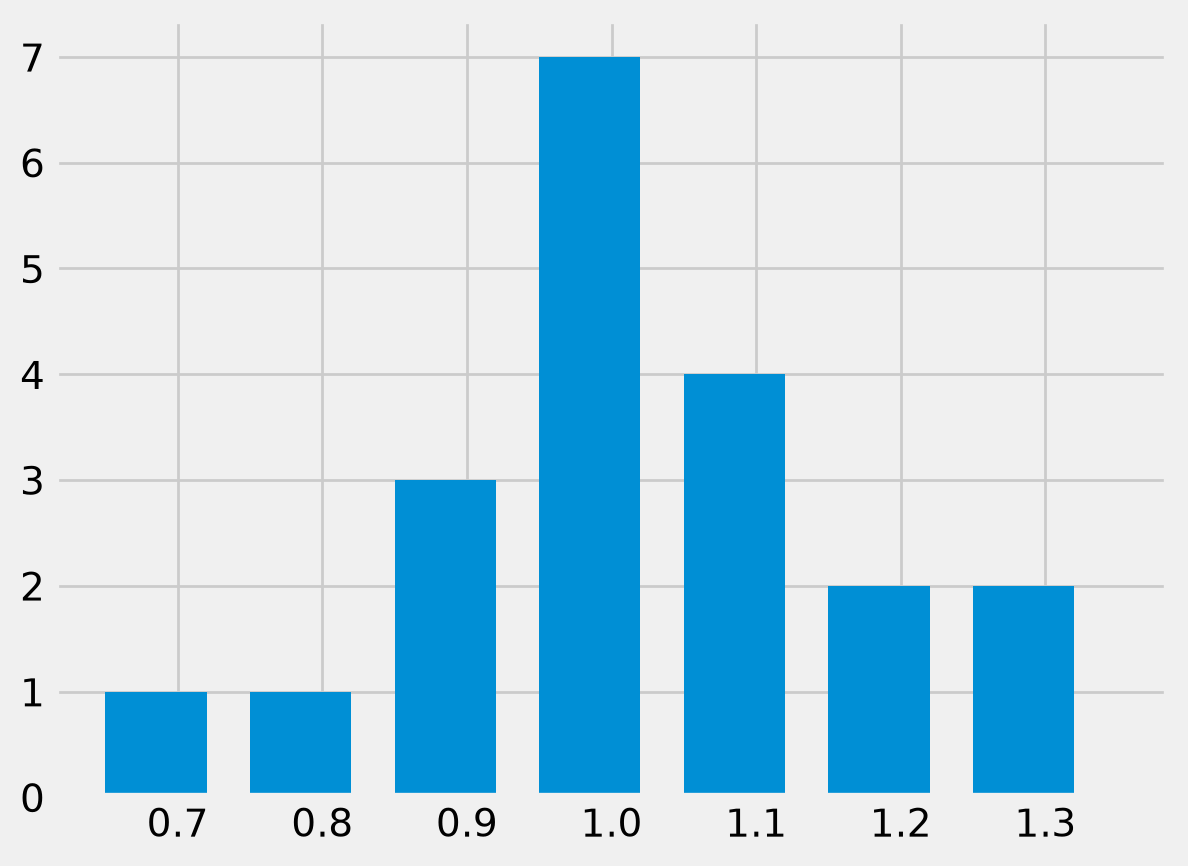
bins_2 = np.arange(0.65, 1.45, 0.1)
print(bins_2)
best number of bins is 7
[0.65 0.75 0.85 0.95 1.05 1.15 1.25 1.35]
- 0: [1. 1. 3. 7. 4. 2. 2.]
- 1: [0.65 0.75 0.85 0.95 1.05 1.15 1.25 1.35]
- 2:
\(\chi^2 = \sum_{j} (n_j - n'_j)^2 / n'_j \quad j = 1,2, ..., k\) bins
\(n'_j = N (p(x_u) - p(x_l))\)
$p(x_u) = \int\limits_{0}^{x_u} G(x) $
the goodness of fit test evaluates the null hypothesis \(H_0\) that the data are described by the assumed distribution
# calculate probability
from math import erf, sqrt
x1 = 0.75
x2 = 0.85
mu = data_1.mean()
sigma = data_1.std()

def probability(x, mu, sigma):
# probability from Z=0 to lower bound
    """ Probability is the area under the Gaussian curve which is identical to the
    cumulative density function value """
    return 0.5 * erf((x - mu) / (sigma * sqrt(2.0)))

def expected(lower, upper, mu, sigma, n):
    """ Expected number of samples in some bin is the number of samples times the
    probability of a variable to be between the lower and upper edge of the bin  """
    return np.abs(n * (st.norm(mu, sigma).cdf(lower) - st.norm(mu, sigma).cdf(upper)))
print(expected(0.75, 0.85, mu, sigma, 20))  # return np.abs(n * (probability(lower,mu,sigma) - probability(upper,mu,sigma)))
1.9142274040853235
oh = np.histogram(data_1, bins=bins_2)
x_3 = []
y = []
for i in range(len(bins_2) - 1):
    x_3.append((oh[1][i] + oh[1][i + 1]) / 2)
    y.append(expected(bins_2[i], bins_2[i + 1], mu, sigma, n_2))
chisq = []  # middle of the bin
for a, b in zip(oh[0], y):
    chisq.append((a - b) ** 2 / b)
plt.bar(x_3, y, width=0.02, color='r', alpha=0.8)
plt.bar(x_3, oh[0], width=0.05, alpha=0.5)
plt.legend(('$E_i$', '$O_i$'))
print(f'chi square = {np.sum(chisq)}')
chi square = 2.7045133358700784
Confidence level is 74.54280566662284 percent
From sample to population statistics
or from a histogram to the probability density function