Outlier Detection: Comparing Tests
import numpy as np
import matplotlib.pyplot as pl

import matplotlib as mpl
mpl.rcParams['lines.linewidth']=2
mpl.rcParams['lines.color']='r'
mpl.rcParams['figure.figsize']=(10,8)
mpl.rcParams['font.size']=14
mpl.rcParams['axes.labelsize']=20
Single variable, \(x\)
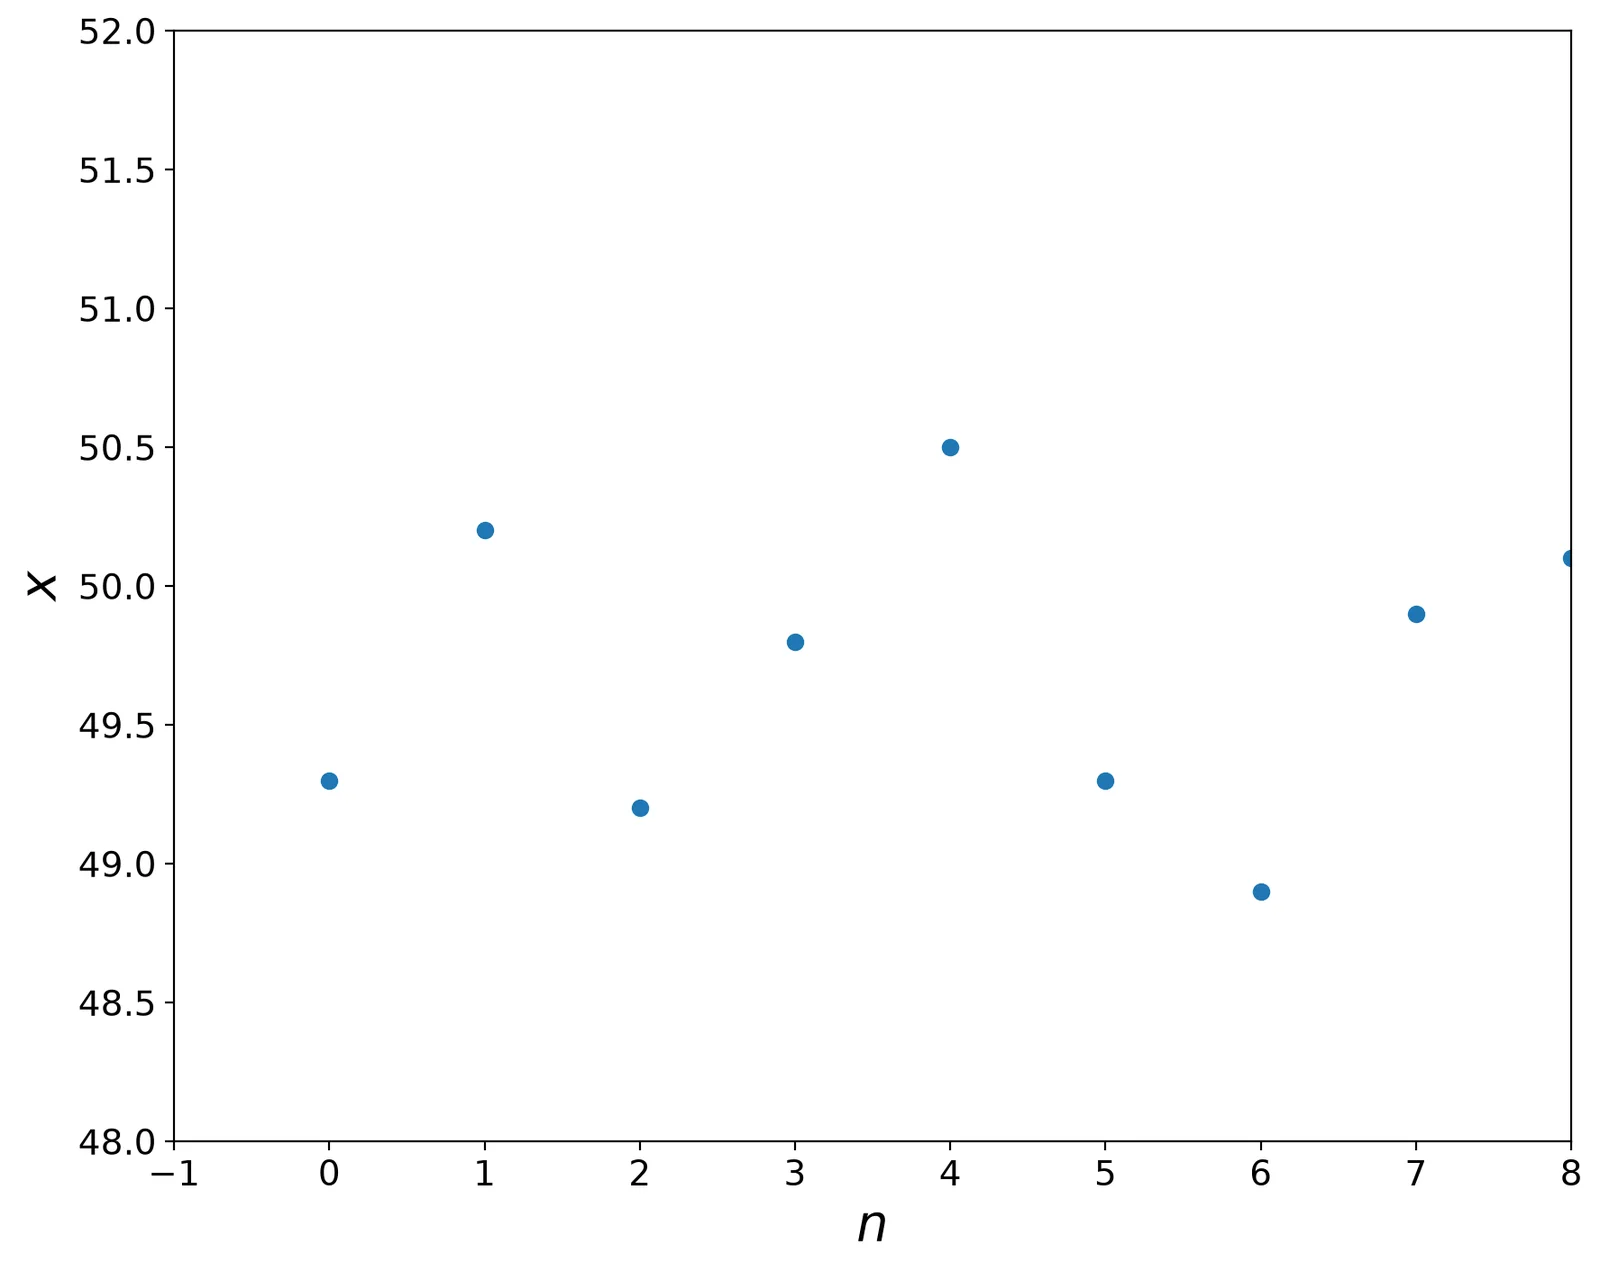
We use modified Thompson test (based on Student's t-distribution)
Sort the values
array([48.9, 49.2, 49.2, 49.3, 49.3, 49.8, 49.9, 50.1, 50.2, 50.5])
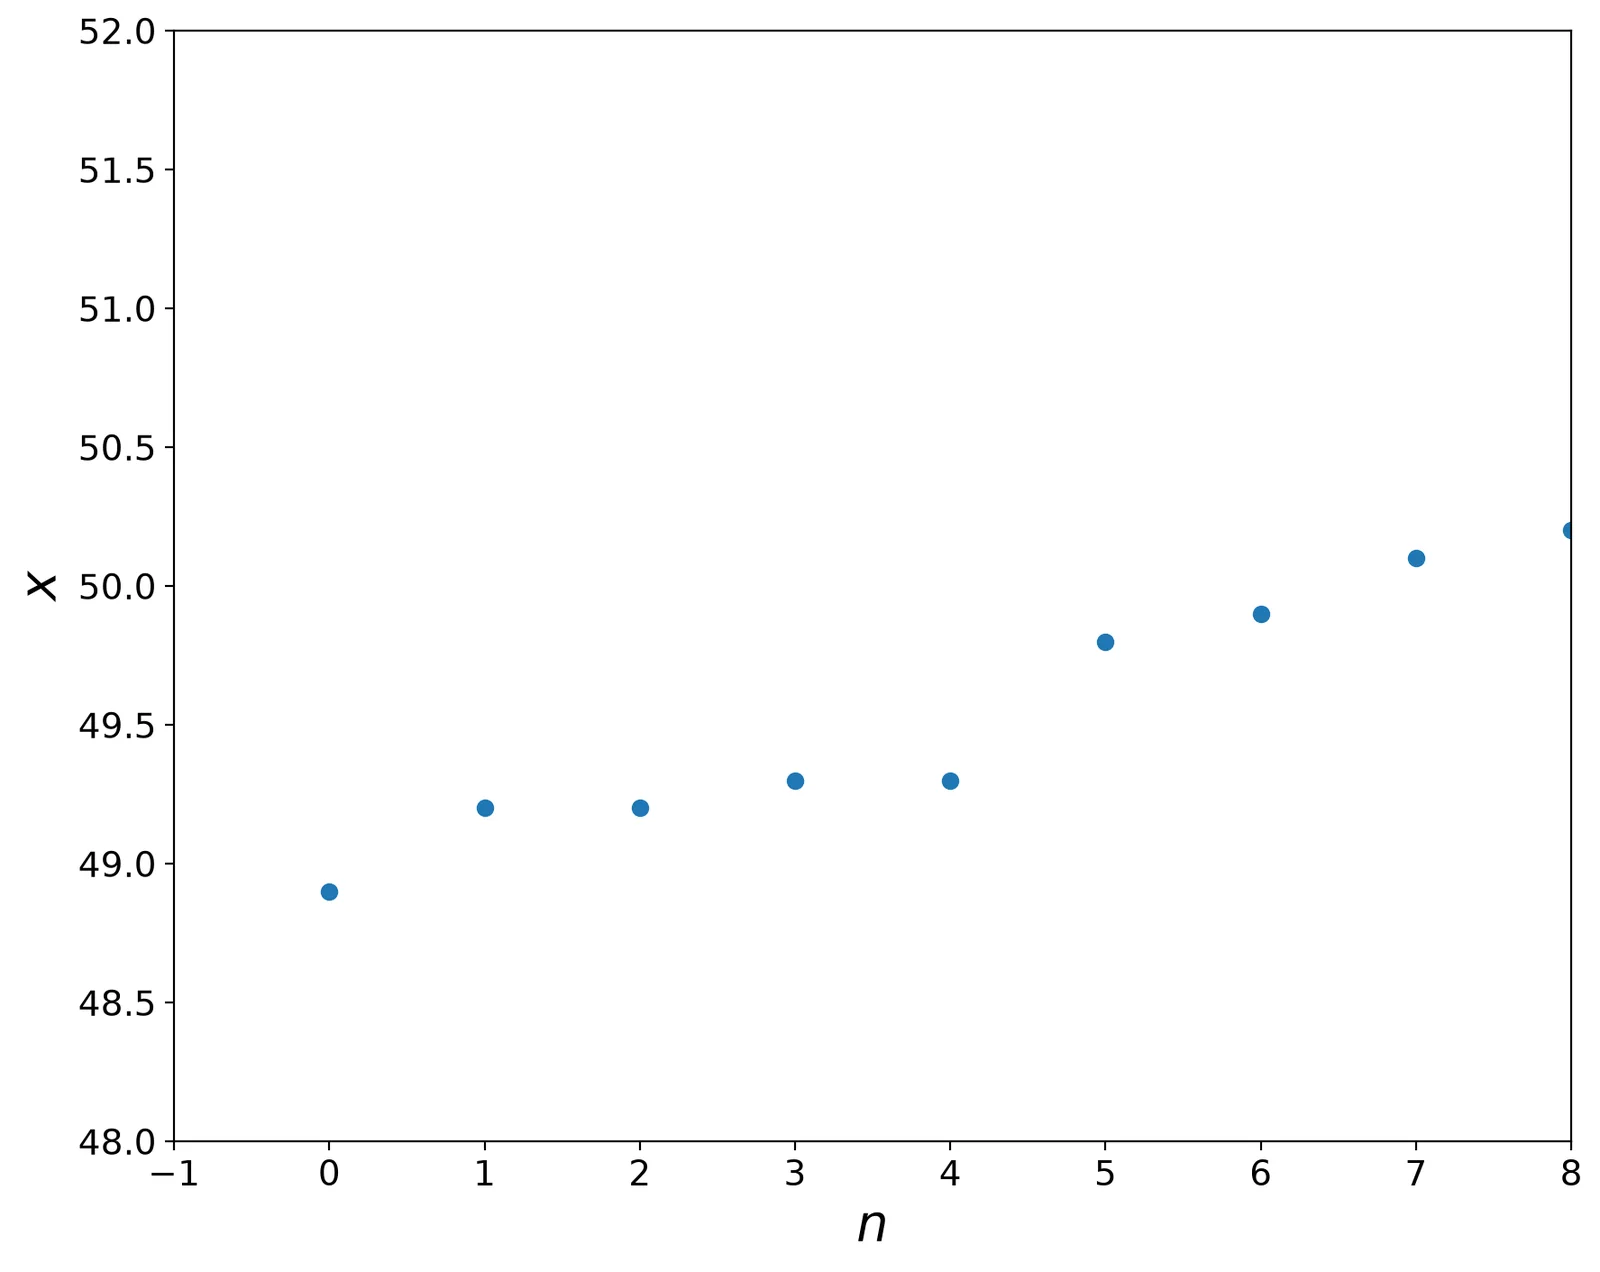
Note: we suspect in the sorted list of values the first and the last
get the sample mean and sample standard deviation, get deviations
49.64
0.5295700562196137
\(\delta_i = | x - x_i |\)
delta = abs(x - x_mean)
pl.plot(delta,'o')
pl.xlim([-1,8])
pl.ylim([-.5,1])
pl.ylabel('$\delta$')
pl.xlabel('$n$')
print (delta[0],delta[-1])
0.740000000000002 0.8599999999999994