Step responses of dynamical systems
#!/usr/bin/env python
from numpy import arange
from matplotlib import pyplot as plt
from scipy import signal
import matplotlib as mpl
mpl.rcParams['lines.linewidth'] = 2
mpl.rcParams['lines.color'] = 'r'
mpl.rcParams['figure.figsize'] = (10, 10)
mpl.rcParams['font.size'] = 14
mpl.rcParams['axes.labelsize'] = 20
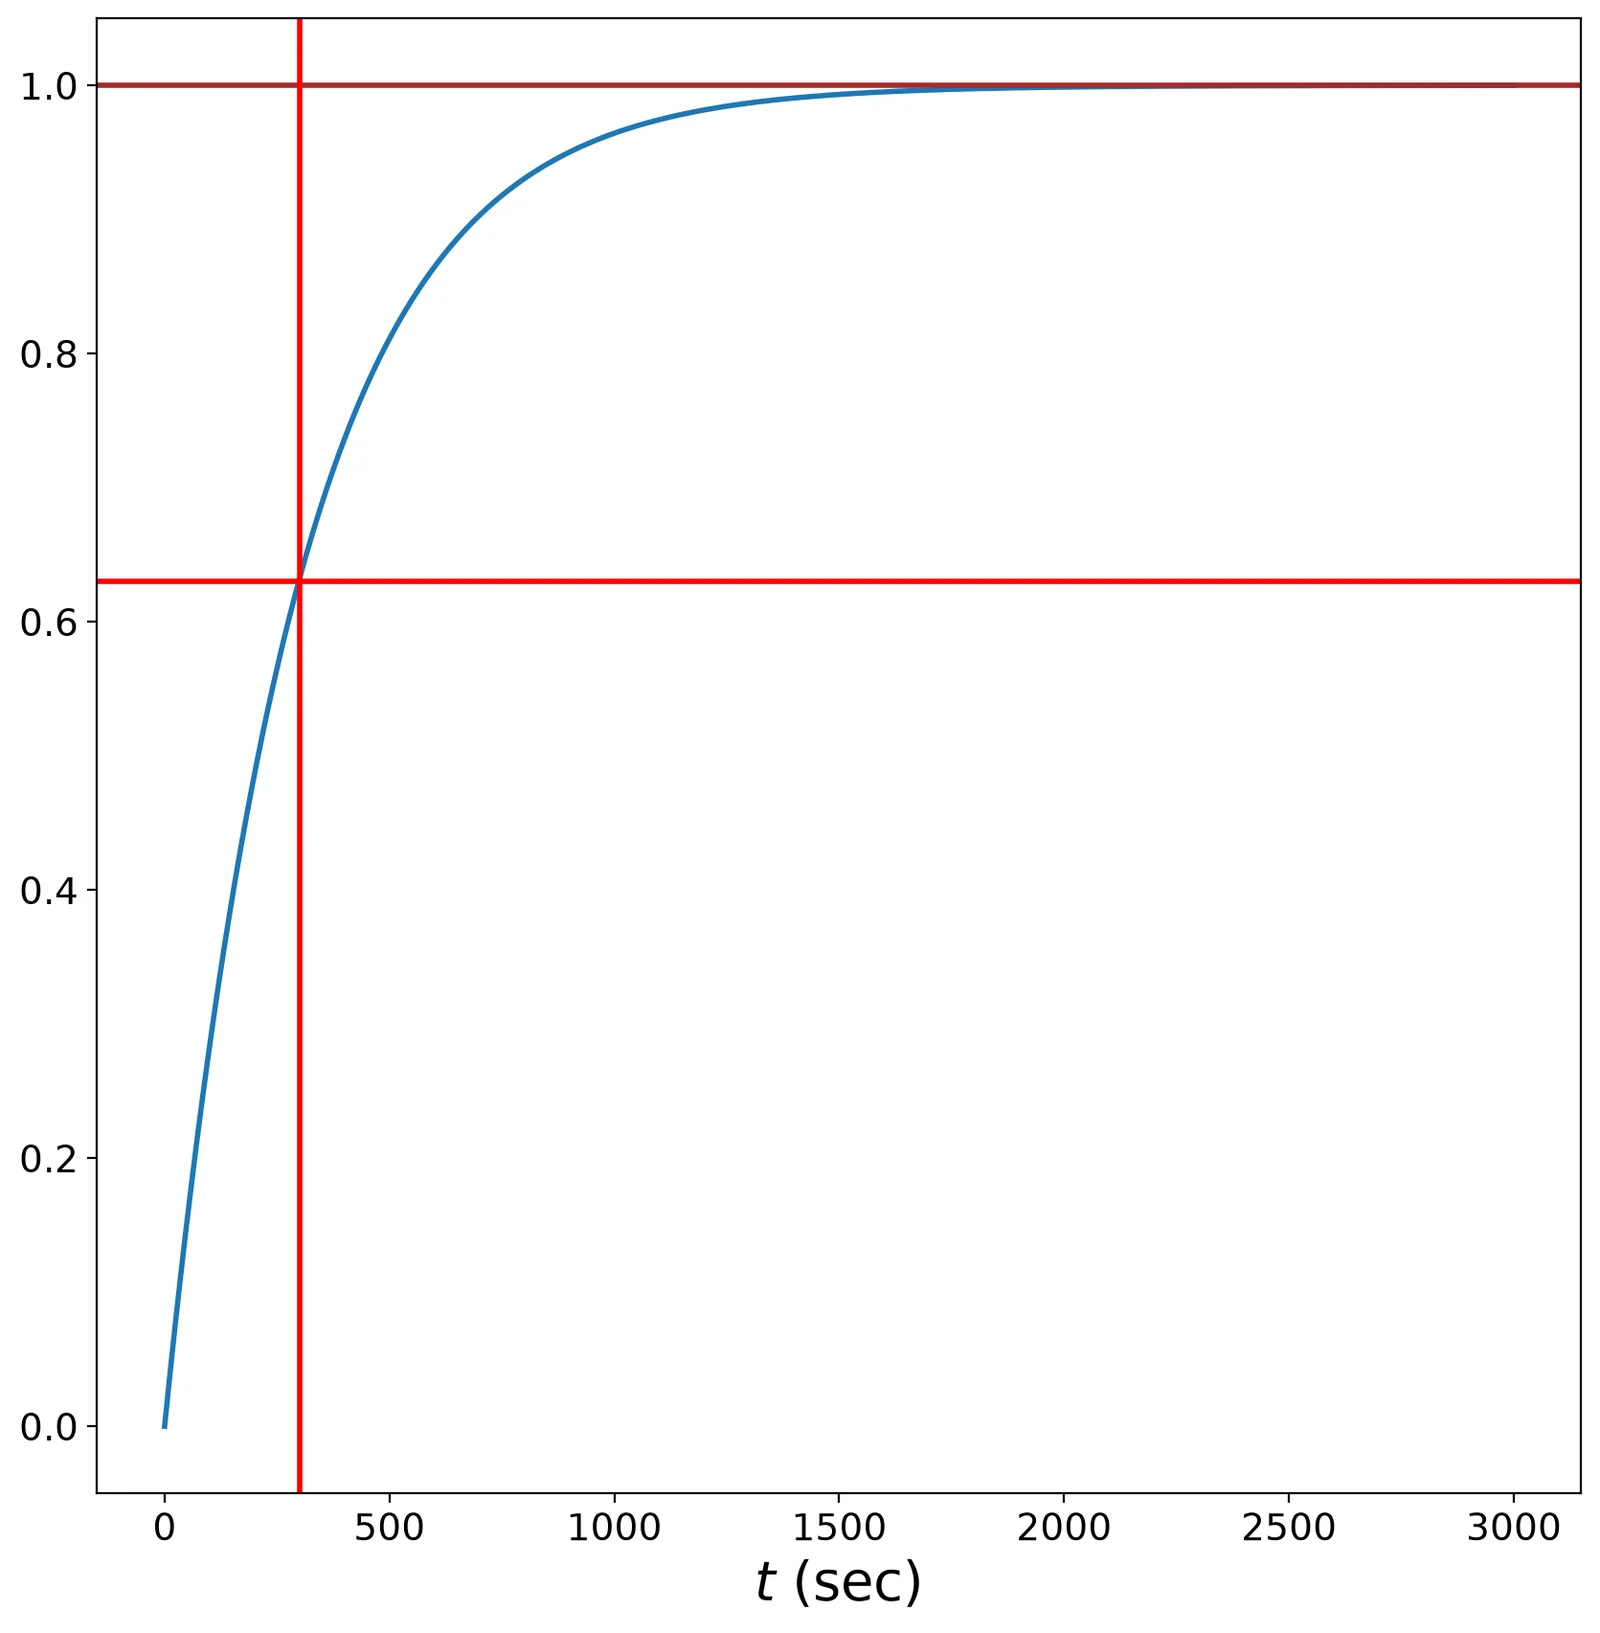
_tau = 5.0 * 60
_h_times = arange(0.0, 10 * _tau, 0.1)
_sys = signal.lti(1, [1, 1.0 / _tau])  # 5 minutes
_step_response = _sys.step(T=_h_times)[1]
plt.plot(_h_times, _step_response / _step_response[-1])
plt.axhline(1.0, color='brown')
plt.axhline(0.63, color='red')
plt.axvline(_tau, color='red')
# plt.title('Step response')
# plt.show()
plt.xlabel('$t$ (sec)')  # normalized
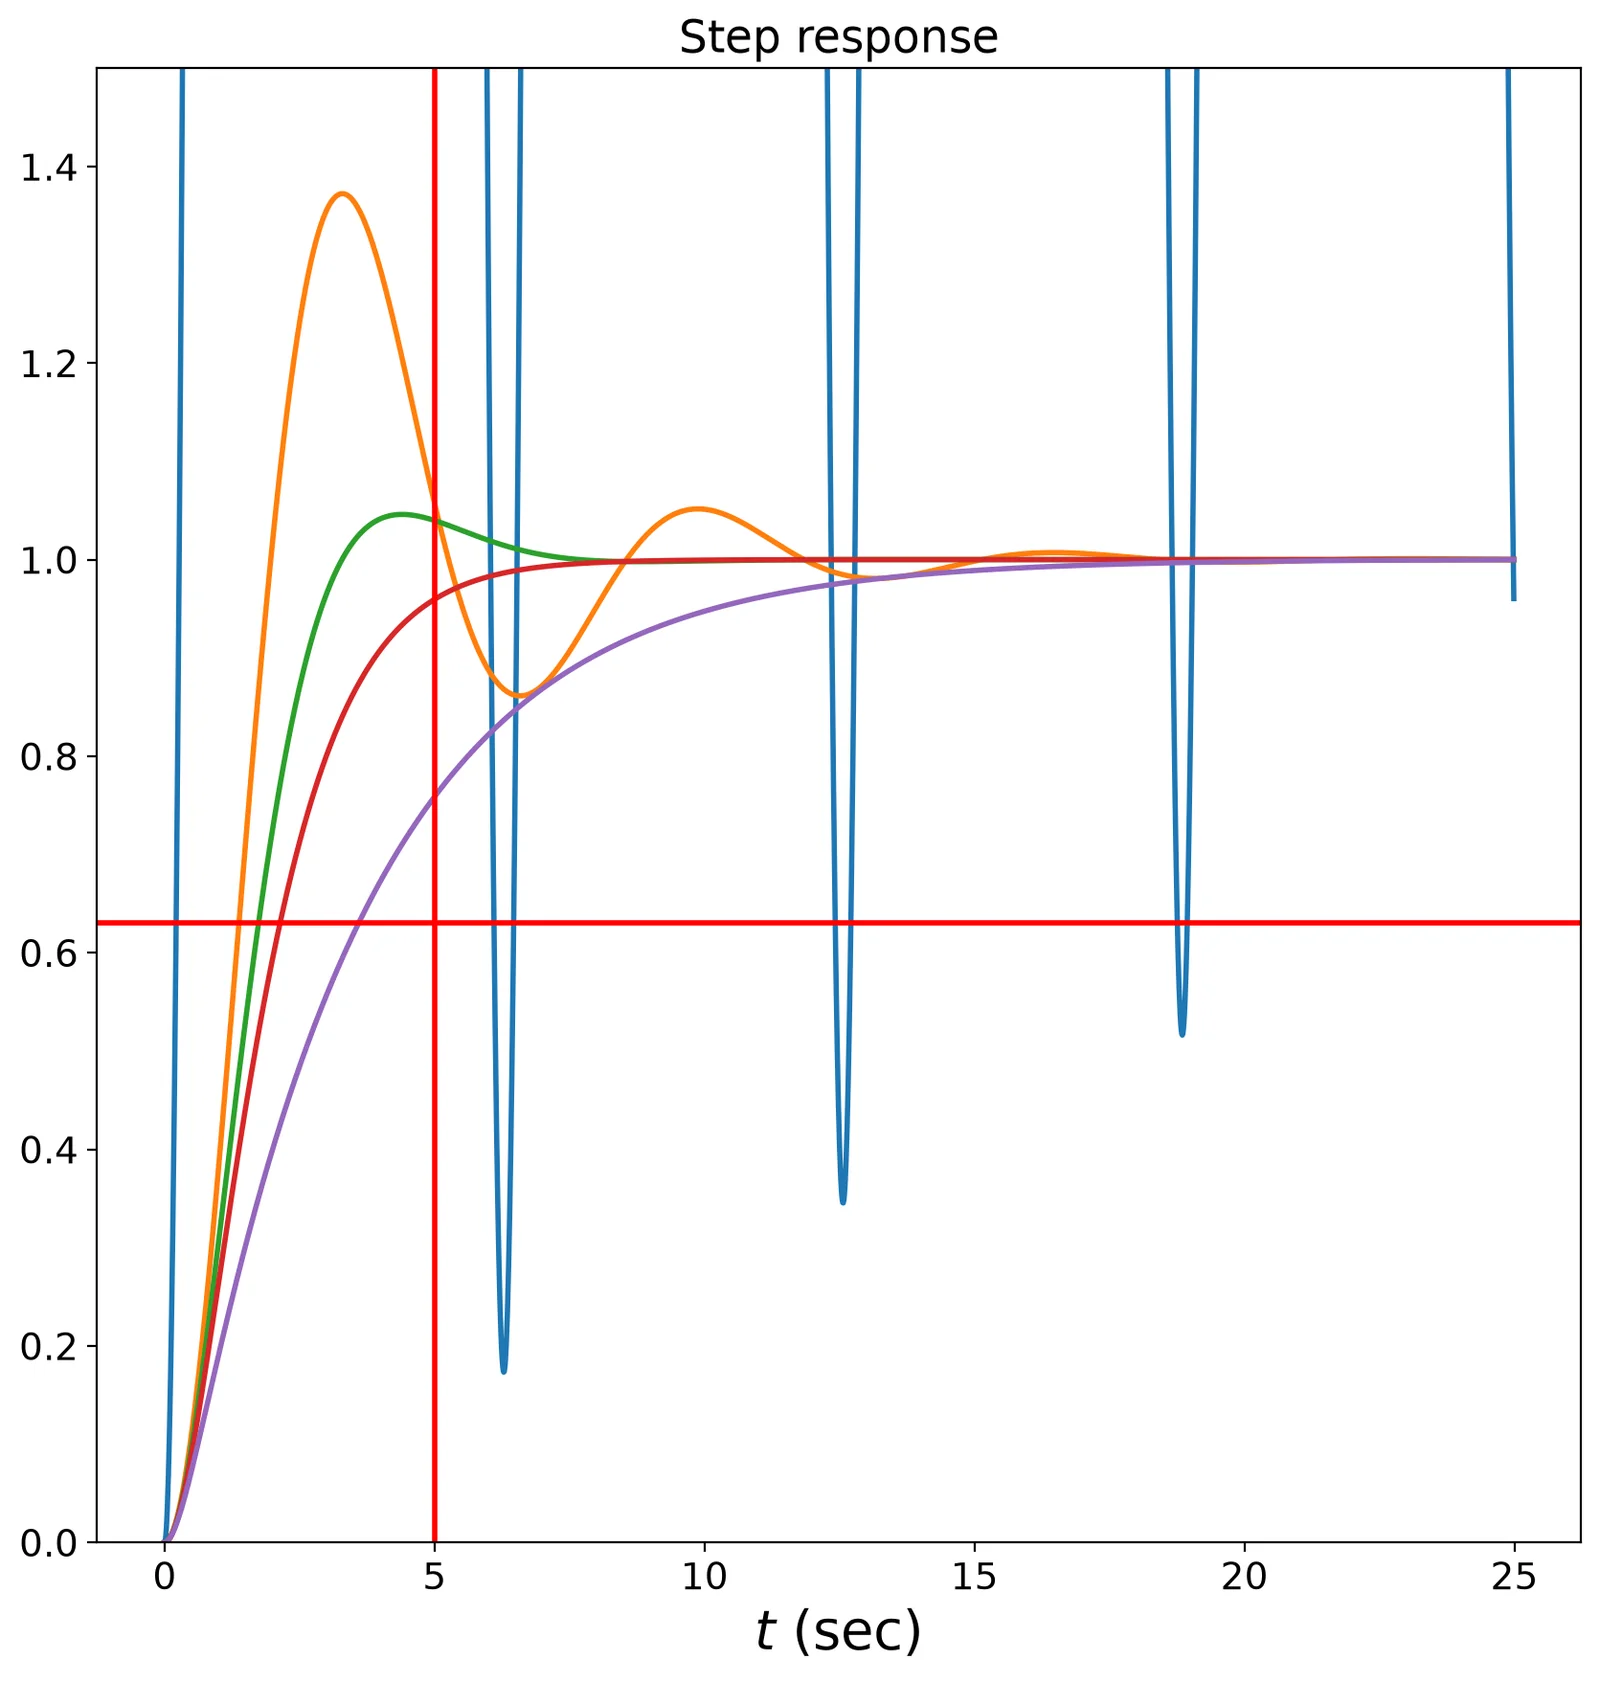
_tau = 5.0  # 5 sec
_h_times = arange(0.0, 5 * _tau, 0.01)
omega_n = 1
for zeta in [0.001, 0.3, 0.7, 1, 1.8]:  # rad/s
    _sys = signal.lti(1, [1, 2 * zeta / omega_n, 1.0 / omega_n ** 2])
    _step_response = _sys.step(T=_h_times)[1]
    plt.plot(_h_times, _step_response / _step_response[-2])  # zeta = 0.1  # damping
plt.axhline(0.63, color='red')
plt.axvline(_tau, color='red')
plt.xlabel('$t$ (sec)')  # normalized
plt.title('Step response')
plt.ylim([0, 1.5])
plt.show()