%pylab inline
%pylab is deprecated, use %matplotlib inline and import the required libraries.
Populating the interactive namespace from numpy and matplotlib
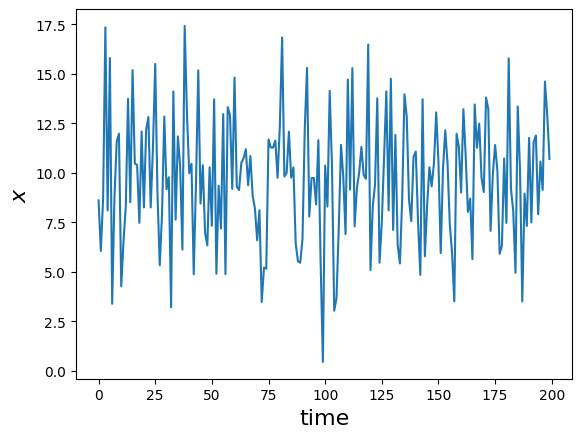
x = random.normal(10.0, 3.0,size=200)
plot(x)
xlabel('time',fontsize=16)
ylabel(r'$x$',fontsize=16)
Text(0, 0.5, '$x$')
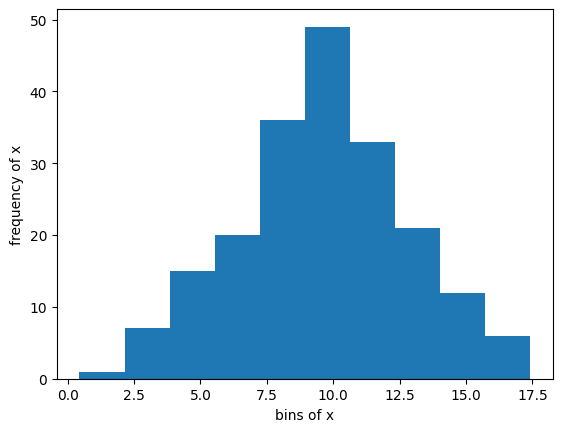
h = hist(x)
xlabel('bins of x')
ylabel('frequency of x')
Text(0, 0.5, 'frequency of x')
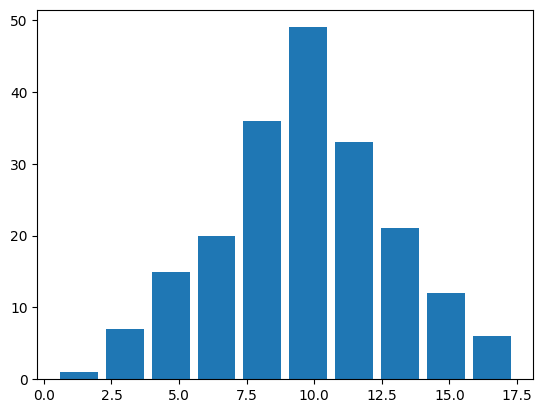
# make it yourself
pos = h[1][:-1]+diff(h[1])/2.
frequency = h[0]
bar(pos,frequency,width=1.4)
<BarContainer object of 10 artists>
# now we can normalize:
probability = frequency/sum(frequency)
bar(pos,probability,width=1.4)
xlabel('bins of x')
ylabel('probability')
Text(0, 0.5, 'probability')

dx = diff(pos)[0]
print(('{:.2f}'.format(dx)))
1.70
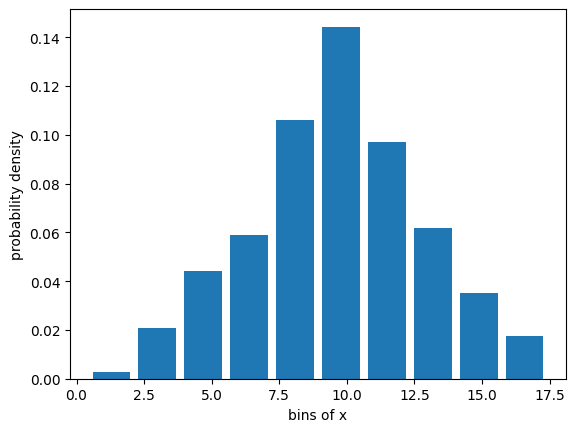
density = probability/dx
bar(pos,density,width=1.4)
xlabel('bins of x')
ylabel('probability density')
Text(0, 0.5, 'probability density')
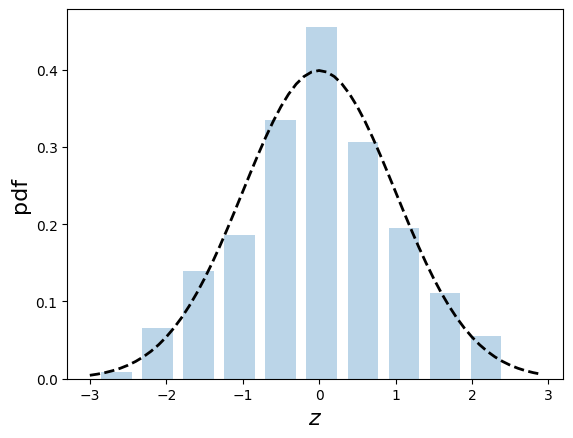
z = (pos - x.mean())/x.std()
# probability density function
pdf = x.std() * density
from scipy.stats import norm

y = norm.pdf( z, 0, 1)
bar(z,pdf,alpha=.3,width=.4),
zi = arange(-3,3,.1)
yi = norm.pdf( zi, 0, 1)
plot(zi, yi, 'k--', linewidth=2)
xlabel(r'$z$',fontsize=16)
ylabel(r'pdf', fontsize=16);