Analog to digital (A/D) and Digital to Analog (d/A) conversion example#
import numpy as np
import matplotlib.pyplot as plt
%matplotlib inline

def reconstruct_with_sinc(ts,fd,t):
    n, = ts.shape
    dt = ts[1] - ts[0]
    fr = []
    for k,ti in enumerate(t):
        # for each time point
        sumf = 0.0
        for i in range(n):
        # for each point in a sampled set
            sumf += fd[i]*np.sin(np.pi*(ti/dt-i))/(ti/dt-i)

        fr.append((1./np.pi)*sumf)

    return np.asarray(fr)
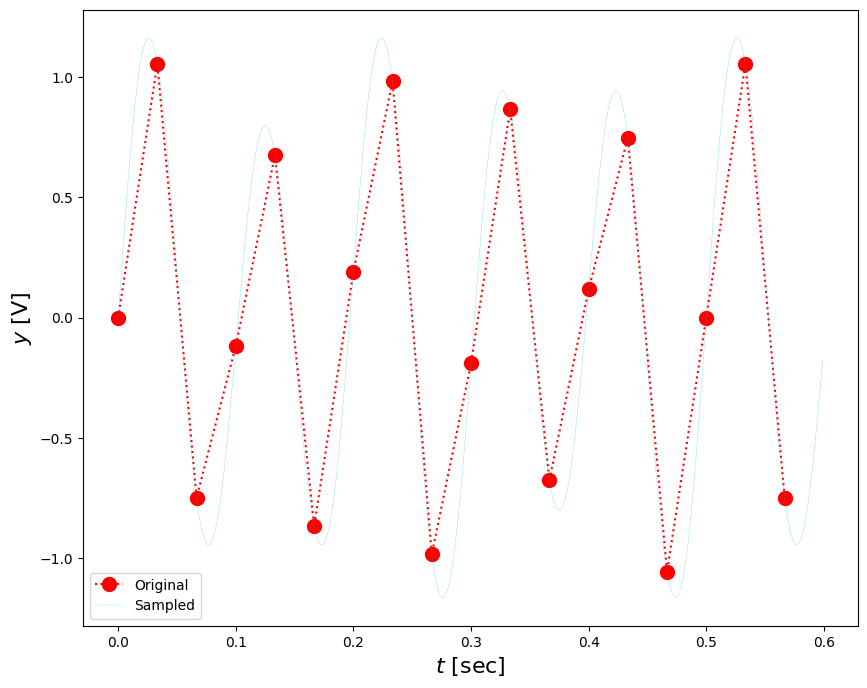
t = np.arange(0.0,0.6,0.001)
fa = 1.0*np.sin(2*np.pi*10*t)+0.2*np.sin(2*np.pi*6*t)
fs = 30 # Hz
ts = np.arange(0.0,0.6,1./fs) # sampling time
fd = 1.0*np.sin(2*np.pi*10*ts)+0.2*np.sin(2*np.pi*6*ts) # sampled data
plt.figure(figsize=(10,8))
plt.plot(ts,fd,':ro',markersize=10)
plt.plot(t,fa,'c--',linewidth=0.2)
plt.xlabel('$t$ [sec]',fontsize=16)
plt.ylabel('$y$ [V]',fontsize=16)
plt.legend(('Original','Sampled'))
<matplotlib.legend.Legend at 0x790a6300fd40>

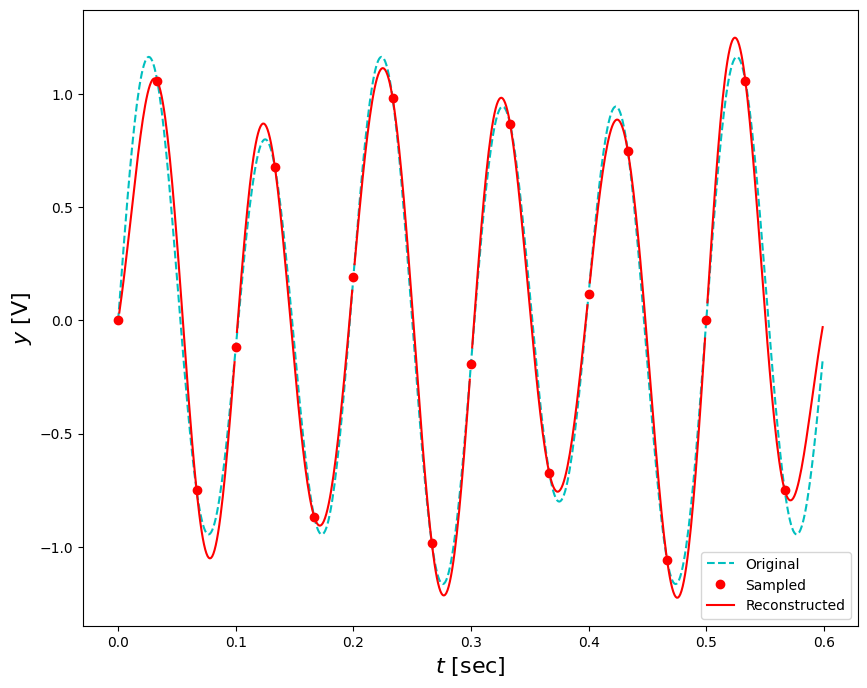
fr = reconstruct_with_sinc(ts,fd,t)
/tmp/ipykernel_274335/1079865406.py:14: RuntimeWarning: invalid value encountered in scalar divide
  sumf += fd[i]*np.sin(np.pi*(ti/dt-i))/(ti/dt-i)
plt.figure(figsize=(10,8))
plt.plot(t,fa,'c--',ts,fd,'ro',t,fr,'r-')
plt.xlabel('$t$ [sec]',fontsize=16)
plt.ylabel('$y$ [V]',fontsize=16)
plt.legend(('Original','Sampled','Reconstructed'))
<matplotlib.legend.Legend at 0x790a63061820>

