How to estimate the uncertainty of a slope for static calibration or regression#
# data of resistance measurements: voltage vs current
import numpy as np
import matplotlib.pyplot as plt
# data
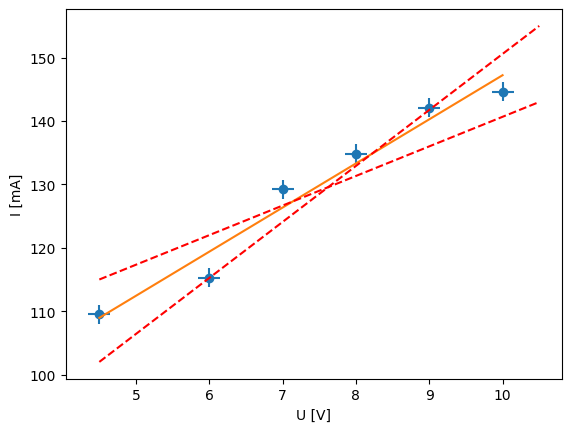
U = np.array([4.5, 6, 7, 8, 9, 10]) # voltage in V
I = np.array([109.5, 115.3, 129.2, 134.8, 142.1, 144.6]) # current in A
plt.plot(U, I, 'o', label='data')
plt.errorbar(U, I, xerr=0.15, yerr=1.5, fmt='none')
plt.plot(np.unique(U), np.poly1d(np.polyfit(U, I, 1))(np.unique(U)), label='fit')
plt.plot([4.5, 10.5], [102,155], 'r--', label='linear fit')
plt.plot([4.5, 10.5], [115,143], 'r--', label='linear fit')
plt.xlabel('U [V]')
plt.ylabel('I [mA]')
Text(0, 0.5, 'I [mA]')
The method:#
Draw the best line using polynomial regression,
polyfitUsing points and error bars draw the minimum and maximum slopes
Get static sensitivity, i.e. slope uncertainty as the half the difference between the max and min slopes
for instance:#
\( m = \frac{147 - 107}{10 - 4.5} = 7.27\) mA/V
\( m = \frac{145 - 115}{10.5 - 4.5} = 5.45\) mA/V
\( m = \frac{152 - 106}{10 - 5} = 9.20 \) mA/V
Uncertainty#
\( \Delta m = (9.20 - 5.45)/2 = 1.875\) mA/V
Use two standard figures and the correct statement:#
The slope is has best estimate of \(7.3 \pm 1.9\) mA/V
# end of the notebook