Spectrum example#
import numpy as np
import matplotlib.pyplot as pl
%matplotlib inline
from matplotlib import rcParams
rcParams.update({'figure.figsize': (10, 8)})
rcParams.update({'font.size': 14})
fs = 100 # Hz
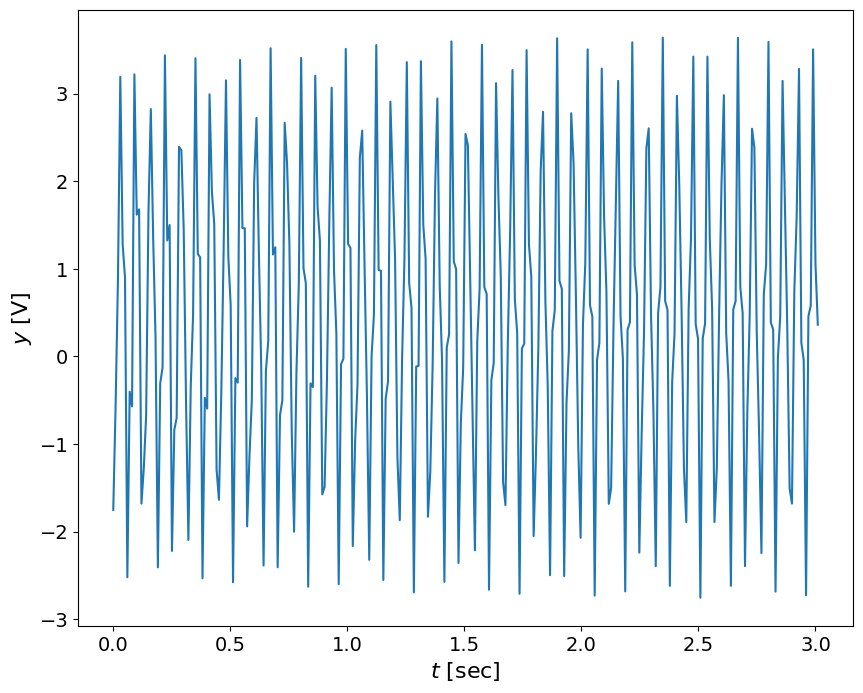
y = np.loadtxt('../data/FFT_Example_data_with_window.txt')
t = np.linspace(0,len(y)/fs,len(y))
pl.plot(t,y)
pl.xlabel('$t$ [sec]',fontsize=16)
pl.ylabel('$y$ [V]',fontsize=16)
Text(0, 0.5, '$y$ [V]')
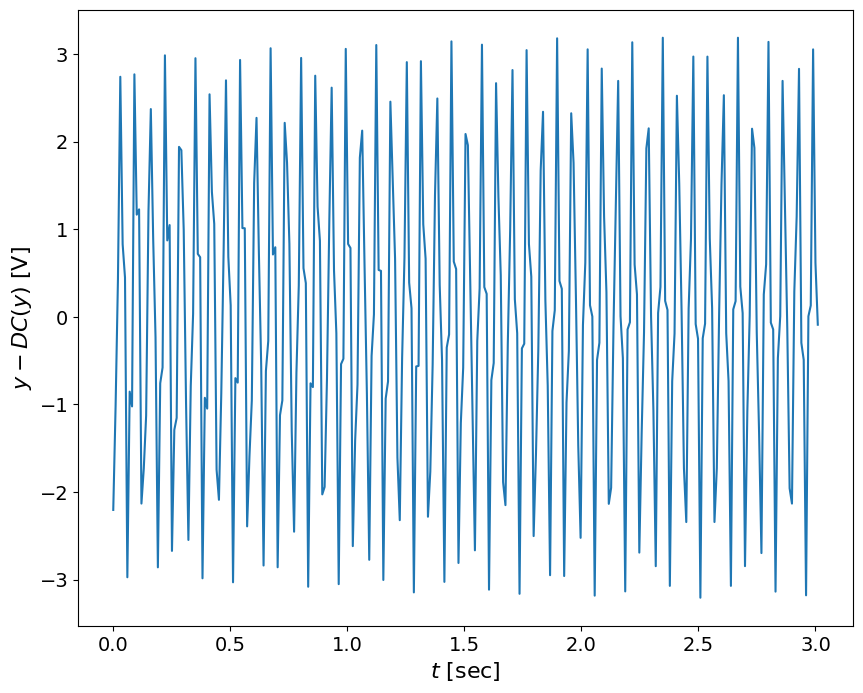
# subtract the DC:
yf = y - np.mean(y)
pl.plot(t,yf)
pl.xlabel('$t$ [sec]',fontsize=16)
pl.ylabel('$y - DC(y) $ [V]',fontsize=16)
Text(0, 0.5, '$y - DC(y) $ [V]')
def spectrum(y,Fs):
    """
    Plots a Single-Sided Amplitude Spectrum of a sampled
    signal y(t), sampling frequency Fs (lenght of a signal
    provides the number of samples recorded)

    Following: http://goo.gl/wRoUn
    """
    n = len(y) # length of the signal
    k = np.arange(n)
    T = n/Fs
    frq = k/T # two sides frequency range
    frq = frq[range(np.int(n/2))] # one side frequency range
    Y = 2*np.fft.fft(y)/n # fft computing and normalization
    Y = Y[range(np.int(n/2))]
    return frq, Y

def plotSignal(t,y,frq,Y):
    """ plots the time signal Y(t) and the
    frequency spectrum Y(fs)
    Inputs:
        t - time
        y - signal
    Outputs:
        t - time signal, [sec]
        Y - values, [Volt]
    Usage:
        plotSignal(t,y,fs)
    """

    # Plot
    pl.figure()
    pl.subplot(2,1,1)
    pl.plot(t,y,'b-')
    pl.xlabel('$t$ [s]',fontsize=16)
    pl.ylabel('$Y$ [V]',fontsize=16)
    # axes().set_aspect(0.2)
    # title('sampled signal')
    pl.subplot(2,1,2)
    pl.plot(frq,abs(Y),'r') # plotting the spectrum
    pl.xlabel('$f$ (Hz)',fontsize=16)
    pl.ylabel('$|Y(f)|$',fontsize=16)
frq,Y = spectrum(yf,fs)
plotSignal(t,yf,frq,Y)
---------------------------------------------------------------------------
AttributeError                            Traceback (most recent call last)
Cell In[7], line 1
----> 1 frq,Y = spectrum(yf,fs)
      2 plotSignal(t,yf,frq,Y)

Cell In[6], line 13, in spectrum(y, Fs)
     11 T = n/Fs
     12 frq = k/T # two sides frequency range
---> 13 frq = frq[range(np.int(n/2))] # one side frequency range
     14 Y = 2*np.fft.fft(y)/n # fft computing and normalization
     15 Y = Y[range(np.int(n/2))]

File ~/mambaforge/envs/mdd/lib/python3.10/site-packages/numpy/__init__.py:324, in __getattr__(attr)
    319     warnings.warn(
    320         f"In the future `np.{attr}` will be defined as the "
    321         "corresponding NumPy scalar.", FutureWarning, stacklevel=2)
    323 if attr in __former_attrs__:
--> 324     raise AttributeError(__former_attrs__[attr])
    326 if attr == 'testing':
    327     import numpy.testing as testing

AttributeError: module 'numpy' has no attribute 'int'.
`np.int` was a deprecated alias for the builtin `int`. To avoid this error in existing code, use `int` by itself. Doing this will not modify any behavior and is safe. When replacing `np.int`, you may wish to use e.g. `np.int64` or `np.int32` to specify the precision. If you wish to review your current use, check the release note link for additional information.
The aliases was originally deprecated in NumPy 1.20; for more details and guidance see the original release note at:
    https://numpy.org/devdocs/release/1.20.0-notes.html#deprecations