Plot power spectrum of experimental data#
import numpy as np
import matplotlib.pylab as p
# u = np.loadtxt('../data/data_for_FFT.txt')
data = np.loadtxt('../data/p40_20.ts')
# data source:
# http://ldvproc.nambis.de/data/ektdata.html
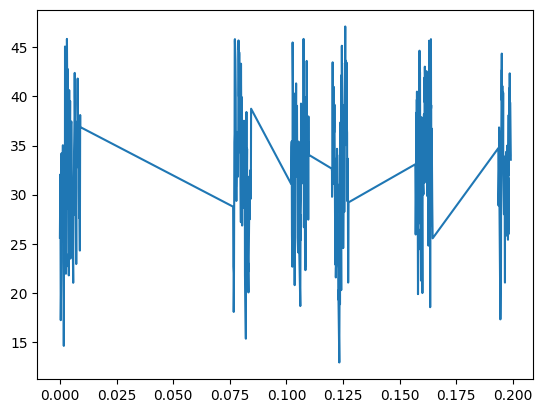
p.plot(data[:500,0],data[:500,1])
[<matplotlib.lines.Line2D at 0x7fac6487f940>]
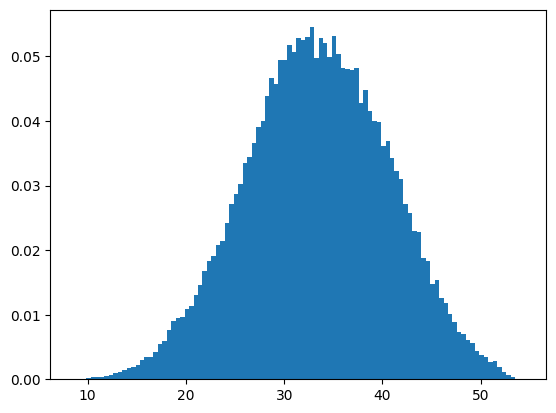
p.hist(data[:,1],101,density=True);
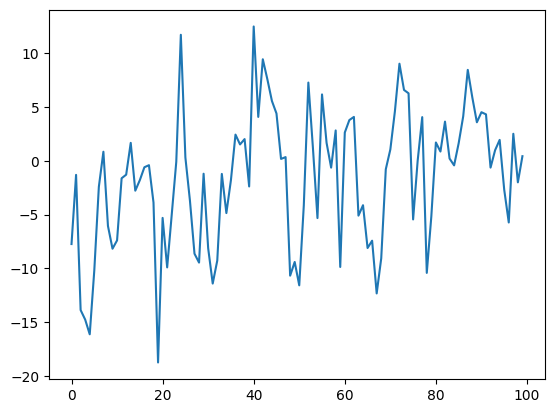
u = data[:,1]

meanu = u.mean()
uf = u - meanu
p.plot(uf[:100])
[<matplotlib.lines.Line2D at 0x7fac61ed4760>]
def powerspectrum(x):
    s = np.fft.fft(x)
    return np.real(s*np.conjugate(s))
specu = powerspectrum(uf)
lenu, = specu.shape
p.plot(specu[2:np.int(lenu/2)])
---------------------------------------------------------------------------
AttributeError                            Traceback (most recent call last)
Cell In[9], line 1
----> 1 p.plot(specu[2:np.int(lenu/2)])

File ~/mambaforge/envs/mdd/lib/python3.10/site-packages/numpy/__init__.py:324, in __getattr__(attr)
    319     warnings.warn(
    320         f"In the future `np.{attr}` will be defined as the "
    321         "corresponding NumPy scalar.", FutureWarning, stacklevel=2)
    323 if attr in __former_attrs__:
--> 324     raise AttributeError(__former_attrs__[attr])
    326 if attr == 'testing':
    327     import numpy.testing as testing

AttributeError: module 'numpy' has no attribute 'int'.
`np.int` was a deprecated alias for the builtin `int`. To avoid this error in existing code, use `int` by itself. Doing this will not modify any behavior and is safe. When replacing `np.int`, you may wish to use e.g. `np.int64` or `np.int32` to specify the precision. If you wish to review your current use, check the release note link for additional information.
The aliases was originally deprecated in NumPy 1.20; for more details and guidance see the original release note at:
    https://numpy.org/devdocs/release/1.20.0-notes.html#deprecations