t-test#
From https://www.statisticshowto.com/probability-and-statistics/t-test/
## Import the packages
import numpy as np
from scipy import stats
import matplotlib.pyplot as plt
## Define 2 random distributions
#Sample Size
Na = 11
Nb = 15
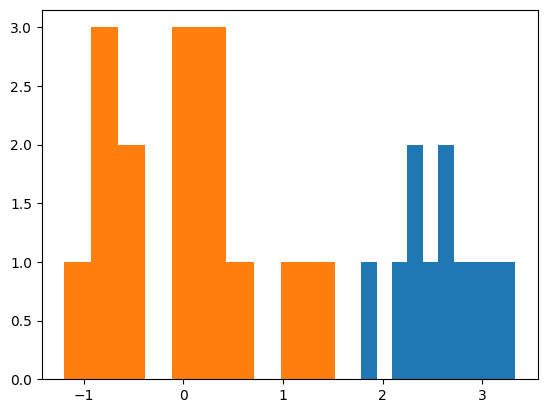
#Gaussian distributed data with mean = 2 and var = 1
a = np.random.randn(Na) + 2
#Gaussian distributed data with with mean = 0 and var = 1
b = np.random.randn(Nb)
plt.hist(a)
plt.hist(b)
## Calculate the Standard Deviation
#Calculate the variance to get the standard deviation
#For unbiased max likelihood estimate we have to divide the var by N-1, and therefore the parameter ddof = 1
var_a = a.var(ddof=1)
var_b = b.var(ddof=1)
#std deviation
s = np.sqrt((var_a + var_b)/2)
s
## Calculate the t-statistics
t = (a.mean() - b.mean())/(s*np.sqrt(2/Na))
## Compare with the critical t-value
#Degrees of freedom
df = np.round(np.mean([Na-1,Nb-1]))
print(f'dof = {df}')
#p-value after comparison with the t
p = 1 - stats.t.cdf(t,df=df)
print("t = " + str(t))
print("p = " + str(2*p))
### You can see that after comparing the t statistic with the critical t value (computed internally) we get a good p value of 0.0005 and thus we reject the null hypothesis and thus it proves that the mean of the two distributions are different and statistically significant.
## Cross Checking with the internal scipy function
t2, p2 = stats.ttest_ind(a,b)
print("t = " + str(t2))
print("p = " + str(p2))
dof = 12.0
t = 10.11367297300865
p = 3.169162412497428e-07
t = 10.473938123352923
p = 1.9747536751537102e-10