Tutorial (interactive notebook)
A live, editable marimo notebook, embedded via the marimo.app playground.
From the original PIVPy tutorial
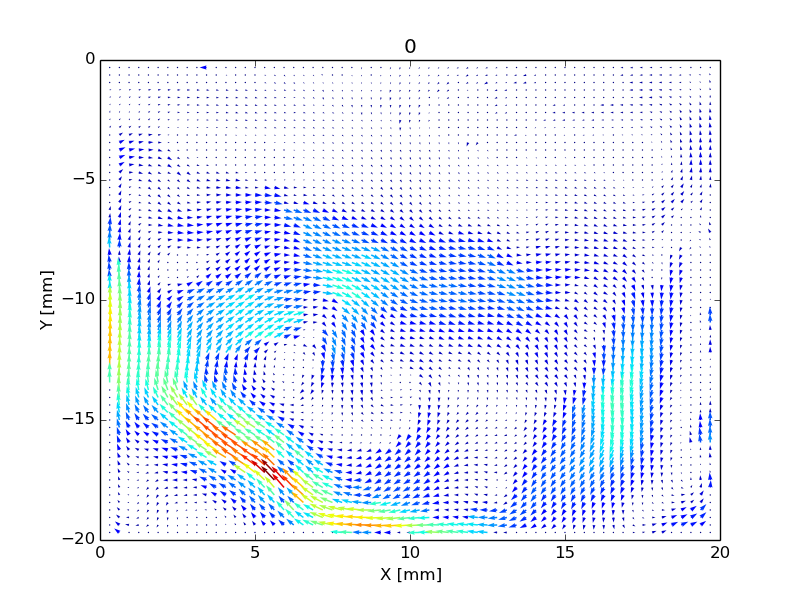
This is what the classic averf() + showf() workflow produced -- a
colored quiver plot of a mean flow field, computed by averaging a
directory of .vec files. Recovered from PIVPy's very first (2014-2019)
documentation site; try reproducing something similar in the notebook
below.