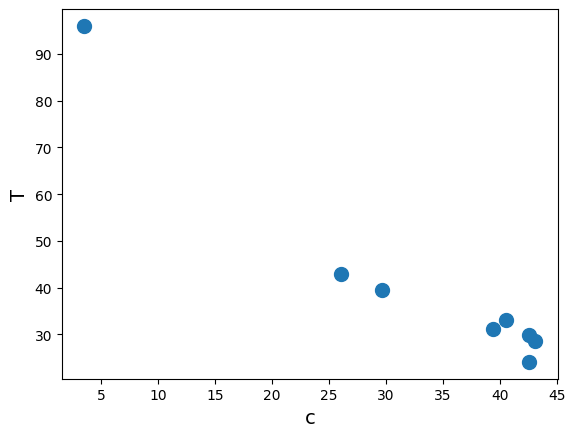
Run the random data generator and plot the scatter#
%run ../scripts/create_random_data
from random import randint
c, T = create_random_set(randint(5,20))
print('\n'.join('{0:.3f} {1:.3f}'.format(*k) for k in zip(c,T)))
3.566 96.027
26.012 42.989
29.612 39.436
39.391 31.032
40.549 32.945
42.509 24.069
42.569 29.759
43.085 28.542
import matplotlib.pyplot as plt
%matplotlib inline
plt.plot(c,T,'o',markersize=10)
plt.xlabel('c',fontsize=14)
plt.ylabel('T',fontsize=14)
Text(0, 0.5, 'T')

