import numpy as np
import matplotlib.pyplot as plt
%matplotlib inline
from scipy.stats import norm, lognorm
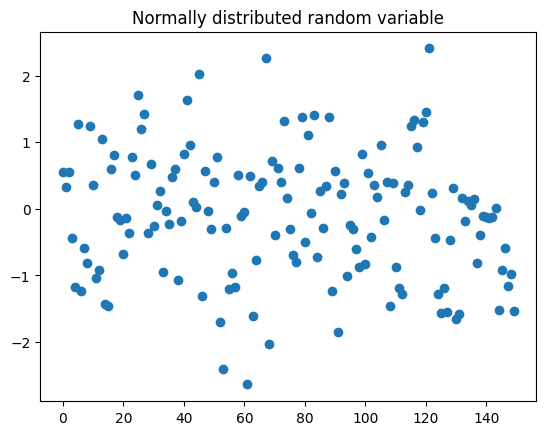
# picking 150 of from a normal distrubution
# with mean 0 and standard deviation 1
samp1 = norm.rvs(loc=0,scale=1,size=150)
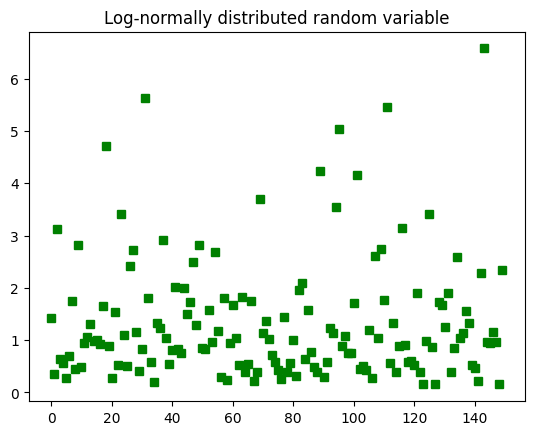
numargs = lognorm.numargs
[ s ] = [0.9,] * numargs
rv = lognorm(s)
samp2 = rv.rvs(size=150)
plt.figure()
plt.plot(samp1,'o')
plt.title('Normally distributed random variable')
plt.figure()
plt.plot(samp2,'gs')
plt.title('Log-normally distributed random variable')
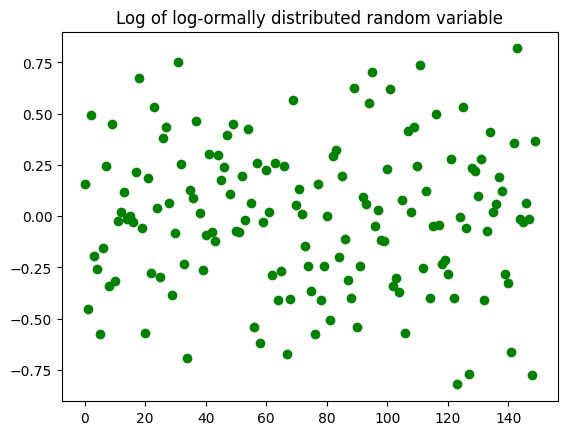
plt.figure()
plt.plot(np.log10(samp2),'go')
plt.title('Log of log-ormally distributed random variable')
# ylim((-2,6))
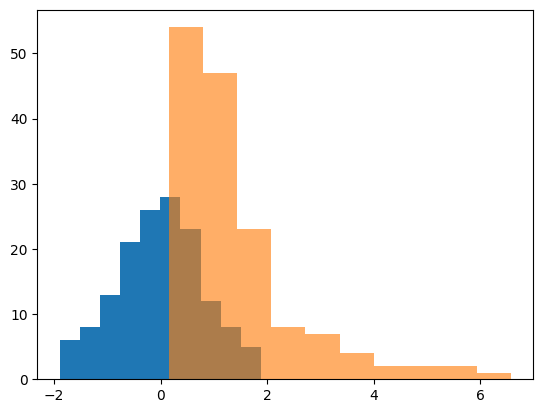
plt.figure();
plt.hist(np.log(samp2));
plt.hist(samp2,alpha=.63);