Amplitude, frequency, period, and phase#
A periodic function can be characterized by the properties: amplitude, frequency, period, and phase. Let’s exemplify these properties for a pediodic function composed by a single frequency, the sine wave or sinusoid trigonometric function:
\[ x(t) = Asin(2 \pi f t + \phi) \]
Where \(A\) is the amplitude, \(f\) the frequency, \(\phi\) the phase, and \(T=1/f\) the period of the function \(x(t)\).
We can define \(\omega=2\pi f = 2\pi/T\) as the angular frequency, then:
\[ x(t) = Asin(\omega t + \phi) \]
Let’s visualize this function:
from __future__ import division, print_function  # for version compatibility
import numpy as np
import matplotlib.pyplot as plt
from scipy import signal
from math import pi, sin, cos, sqrt, atan2
import warnings
warnings.filterwarnings('ignore')
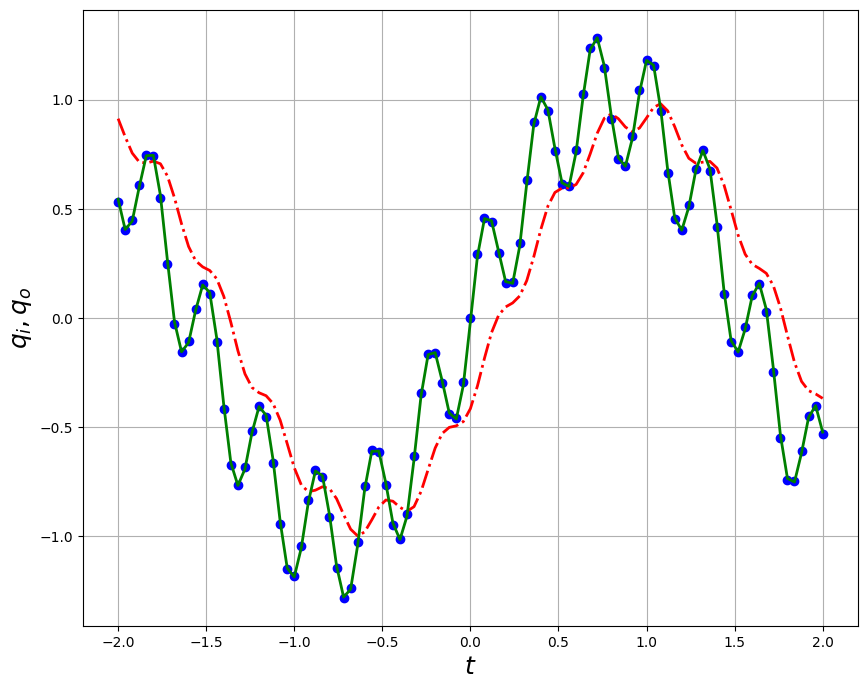
t = np.linspace(-2, 2, 101)                    # time vector
qi = 1 * np.sin(2*t) + 0.3*np.sin(20*t)
qo1 = 0.93 * np.sin(2*t - 21.8/180*np.pi) + 0.072 * np.sin(20*t - 76./180*np.pi)
qo2 = 1 * np.sin(2*t - 0.23/180*np.pi) + 0.3 * np.sin(20*t - 2.3/180*np.pi)
plt.figure(figsize=(10,8))
plt.plot(t,qi,'bo',t,qo1,'r-.',t,qo2,'g-',lw=2)
plt.grid('on')
plt.xlabel('$t$',fontsize=18)
plt.ylabel('$q_i,q_o$',fontsize=18)
plt.show()