import math
import numpy
import pylab
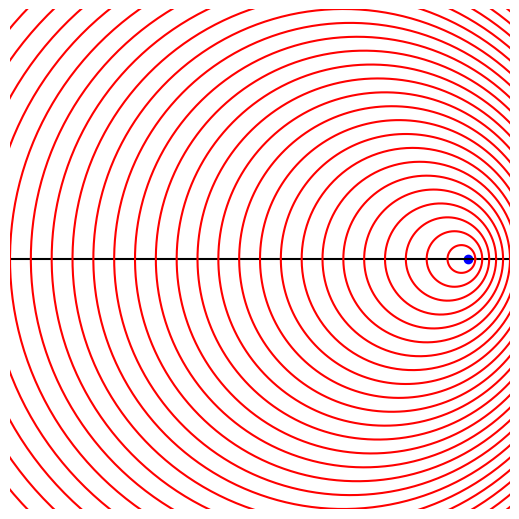
# the wavefront class will hold the location and time that a wavefront
# was emitted
class wavefront:
def __init__ (self, x_emit, y_emit, w, t_emit):
self.x_emit = x_emit
self.y_emit = y_emit
self.w = w # wave propagation speed
self.t_emit = t_emit
def doppler():
# emitter velocity (in x-direction)
vel = 1.0
# emitter initial coords
x_init = 0.0
y_init = 0.0
# wave velocity
w = 2.0
# wave frequency (# of peaks per second)
f = 3.0
# maximum time
tmax = 10.0
dt = 0.01
# create a list of wavefront objects that we can refer to when we
# want to plot things. There are f wavefronts emitted per second,
# so the total number of wavefronts is tmax*f
t = 0
wavefronts = []
while (t <= tmax):
x_emit = x_init + vel*t
y_emit = y_init
wavefronts.append(wavefront(x_emit, y_emit, w, t))
t += 1/f
# debug -- try printing out the wave propagation info
n = 0
while (n < len(wavefronts)):
print (n, wavefronts[n].x_emit, wavefronts[n].y_emit, wavefronts[n].t_emit)
n += 1
xmax = x_init + vel*tmax
# we will be drawing circles, so make an array with the polar angle
npts = 360
theta = numpy.arange(npts)*2*math.pi/(npts-1)
# step forward in time (by dt) and draw any wavefronts that have been emitted
iframe = 0
t = 0
while (t <= tmax):
pylab.clf()
x_source = x_init + vel*t
y_source = y_init
# plot the sources's path
pylab.plot([-1.2*xmax,1.2*xmax],[y_init,y_init],color='k')
# draw the source
pylab.scatter([x_source],[y_source], color='b')
# loop over the wavefronts, and draw any that have been
# emitted so far
n = 0
while (n < len(wavefronts)):
if (wavefronts[n].t_emit > t):
break
r_front = wavefronts[n].w*(t - wavefronts[n].t_emit)
# wavefronts are circles centered on their emitted coordinates
x_front = wavefronts[n].x_emit + r_front*numpy.cos(theta)
y_front = wavefronts[n].y_emit + r_front*numpy.sin(theta)
pylab.plot(x_front, y_front, color='r')
n += 1
pylab.subplots_adjust(left=0,right=1.0,bottom=0,top=1.0)
pylab.axis([-1.2*xmax,1.2*xmax,-1.2*xmax,1.2*xmax])
pylab.axis("off")
f = pylab.gcf()
f.set_size_inches(5.0,5.0)
# outfile = "doppler_%04d.png" % iframe
# pylab.savefig(outfile)
t += dt
iframe += 1