import numpy as np
import matplotlib.pyplot as pl
%matplotlib inline
from matplotlib import rcParams
rcParams.update({'figure.figsize': (10, 8)})
rcParams.update({'font.size': 14})
fs = 100 # Hz
y = np.loadtxt('../data/FFT_Example_data_with_window.txt')
t = np.linspace(0,len(y)/fs,len(y))
pl.plot(t,y)
pl.xlabel('$t$ [sec]',fontsize=16)
pl.ylabel('$y$ [V]',fontsize=16)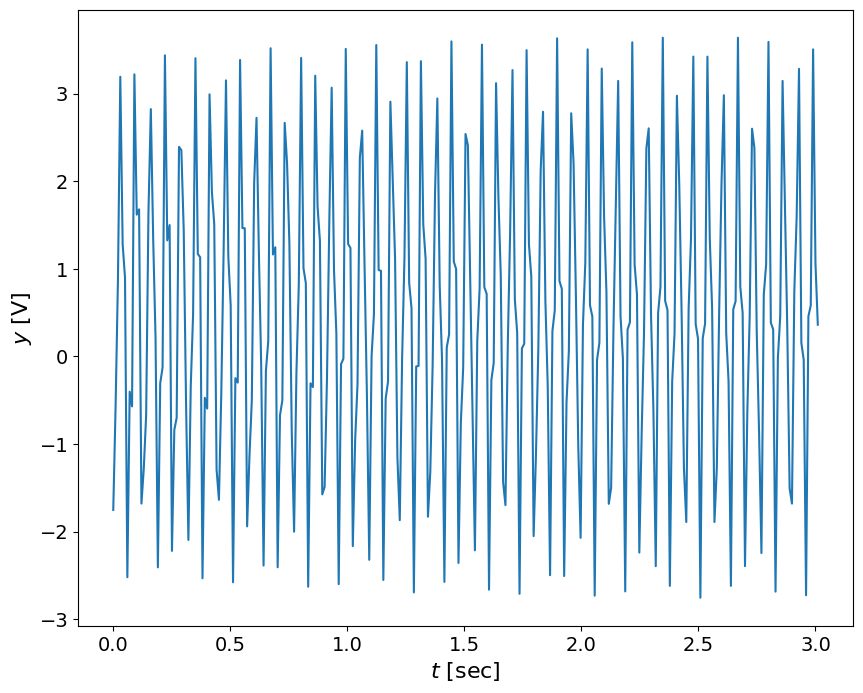
# subtract the DC:
yf = y - np.mean(y)
pl.plot(t,yf)
pl.xlabel('$t$ [sec]',fontsize=16)
pl.ylabel('$y - DC(y) $ [V]',fontsize=16)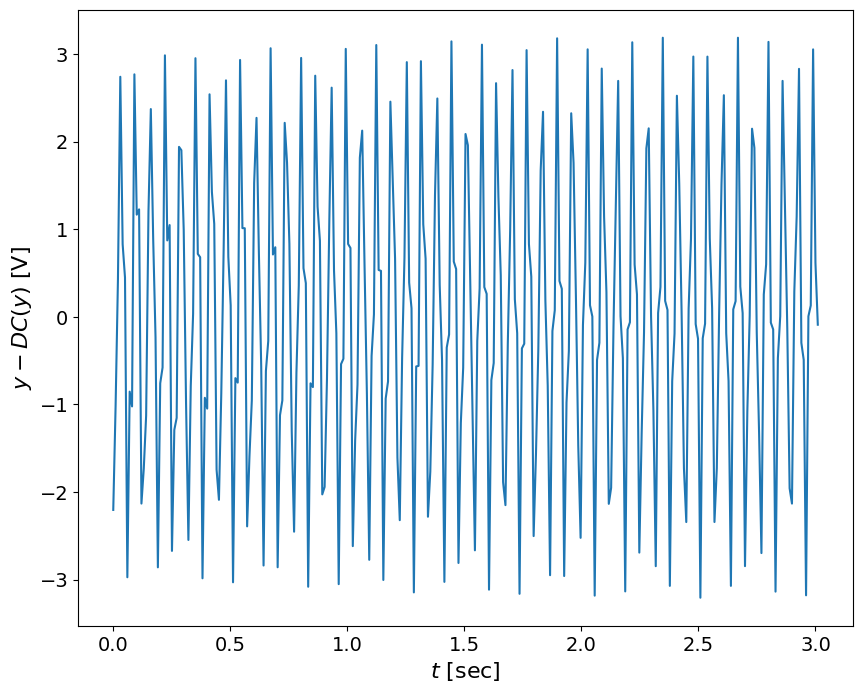
def spectrum(y,Fs):
"""
Plots a Single-Sided Amplitude Spectrum of a sampled
signal y(t), sampling frequency Fs (lenght of a signal
provides the number of samples recorded)
Following: http://goo.gl/wRoUn
"""
n = len(y) # length of the signal
k = np.arange(n)
T = n/Fs
frq = k/T # two sides frequency range
frq = frq[range(np.int(n/2))] # one side frequency range
Y = 2*np.fft.fft(y)/n # fft computing and normalization
Y = Y[range(np.int(n/2))]
return frq, Y
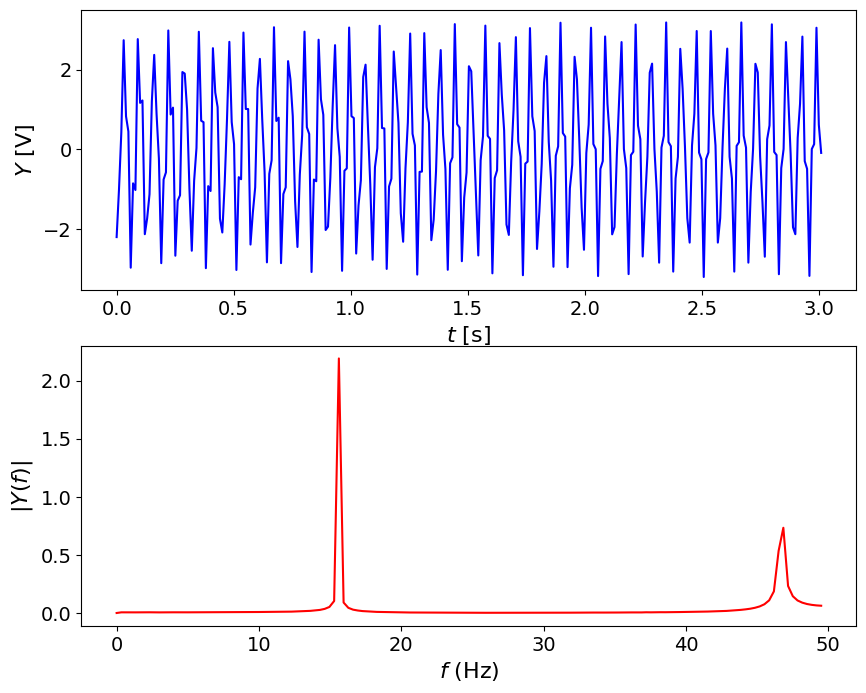
def plotSignal(t,y,frq,Y):
""" plots the time signal Y(t) and the
frequency spectrum Y(fs)
Inputs:
t - time
y - signal
Outputs:
t - time signal, [sec]
Y - values, [Volt]
Usage:
plotSignal(t,y,fs)
"""
# Plot
pl.figure()
pl.subplot(2,1,1)
pl.plot(t,y,'b-')
pl.xlabel('$t$ [s]',fontsize=16)
pl.ylabel('$Y$ [V]',fontsize=16)
# axes().set_aspect(0.2)
# title('sampled signal')
pl.subplot(2,1,2)
pl.plot(frq,abs(Y),'r') # plotting the spectrum
pl.xlabel('$f$ (Hz)',fontsize=16)
pl.ylabel('$|Y(f)|$',fontsize=16)frq,Y = spectrum(yf,fs)
plotSignal(t,yf,frq,Y)/tmp/ipykernel_205905/3529218752.py:13: DeprecationWarning: `np.int` is a deprecated alias for the builtin `int`. To silence this warning, use `int` by itself. Doing this will not modify any behavior and is safe. When replacing `np.int`, you may wish to use e.g. `np.int64` or `np.int32` to specify the precision. If you wish to review your current use, check the release note link for additional information.
Deprecated in NumPy 1.20; for more details and guidance: https://numpy.org/devdocs/release/1.20.0-notes.html#deprecations
frq = frq[range(np.int(n/2))] # one side frequency range
/tmp/ipykernel_205905/3529218752.py:15: DeprecationWarning: `np.int` is a deprecated alias for the builtin `int`. To silence this warning, use `int` by itself. Doing this will not modify any behavior and is safe. When replacing `np.int`, you may wish to use e.g. `np.int64` or `np.int32` to specify the precision. If you wish to review your current use, check the release note link for additional information.
Deprecated in NumPy 1.20; for more details and guidance: https://numpy.org/devdocs/release/1.20.0-notes.html#deprecations
Y = Y[range(np.int(n/2))]