import numpy as np
import matplotlib.pylab as p
# u = np.loadtxt('../data/data_for_FFT.txt')
data = np.loadtxt('../data/p40_20.ts')
# data source:
# http://ldvproc.nambis.de/data/ektdata.html p.plot(data[:500,0],data[:500,1])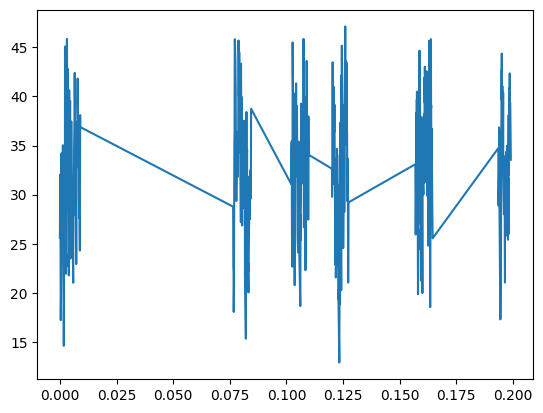
p.hist(data[:,1],101,density=True);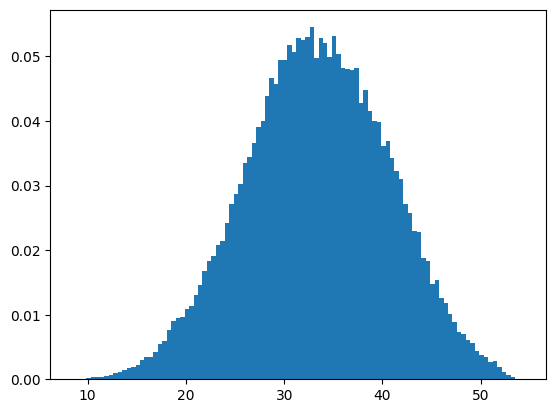
u = data[:,1]

meanu = u.mean()
uf = u - meanu
p.plot(uf[:100])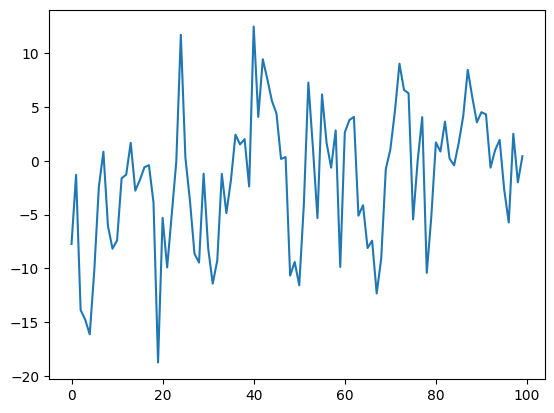
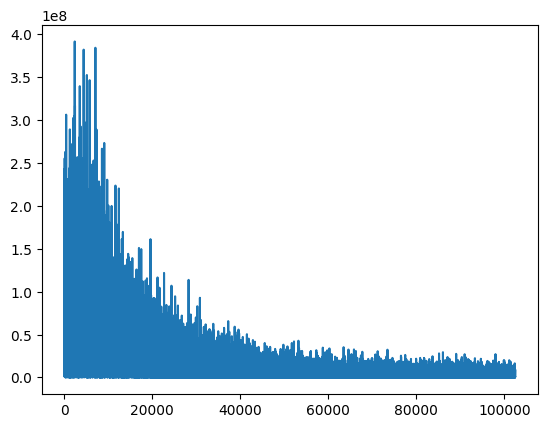
def powerspectrum(x):
    s = np.fft.fft(x)
    return np.real(s*np.conjugate(s))
specu = powerspectrum(uf)
lenu, = specu.shape
p.plot(specu[2:int(lenu/2)])