Linearity error example#
import numpy as np
import matplotlib.pyplot as pl
%matplotlib inline

pl.rcParams['figure.figsize'] = 10, 8
pl.rcParams['font.size'] = 18
x = np.r_[np.linspace(20,220,10), np.linspace(180,0,9)]
y = np.array([20,40,59,77,97,117,137,156,175,195,176,156,136,117,97,78,58,39,20])
print(f'x = {x}')
print(f'y = {y}')
x = [ 20.          42.22222222  64.44444444  86.66666667 108.88888889
 131.11111111 153.33333333 175.55555556 197.77777778 220.
 180.         157.5        135.         112.5         90.
  67.5         45.          22.5          0.        ]
y = [ 20  40  59  77  97 117 137 156 175 195 176 156 136 117  97  78  58  39
  20]
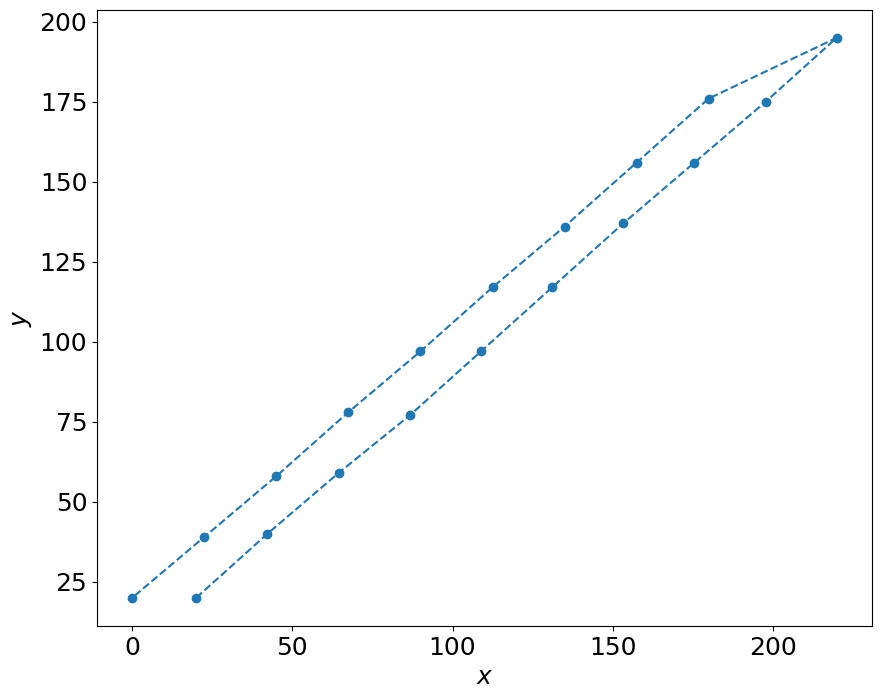
pl.plot(x,y,'--o')
pl.xlabel(r'$x$')
pl.ylabel(r'$y$')
Text(0, 0.5, '$y$')
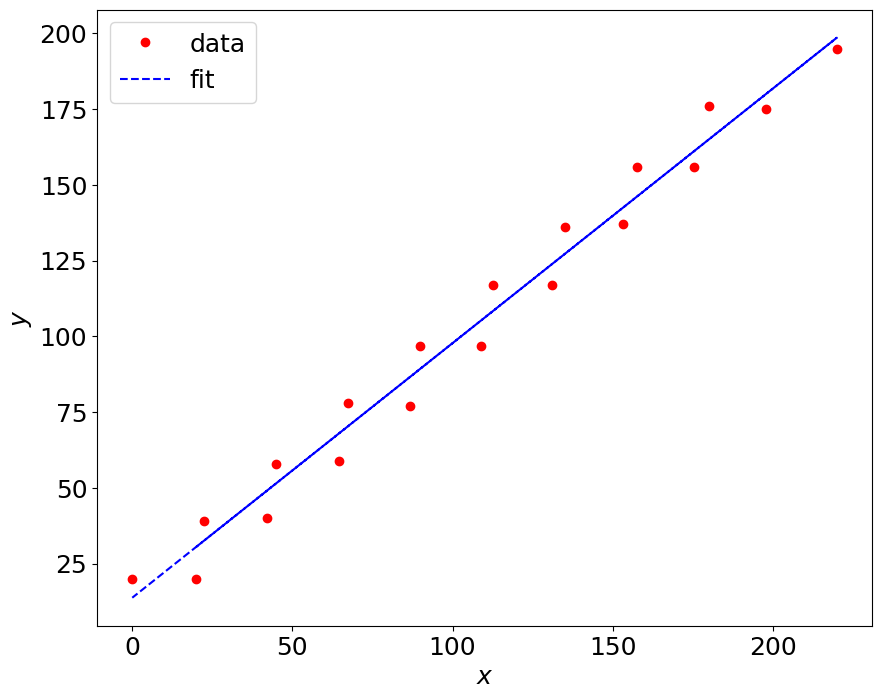
# create best fit
p = np.polyfit(x,y,1)
print (p)
y_fit = np.polyval(p,x)
[ 0.8402436 13.74265035]
pl.plot(x,y,'ro',x,y_fit,'b--')
pl.xlabel(r'$x$')
pl.ylabel(r'$y$')
pl.legend(('data','fit'),loc='best')
<matplotlib.legend.Legend at 0x7cb18fb0c350>
print (f'measured y = {y}')
print (f'estimated y = {y_fit}')
measured y = [ 20  40  59  77  97 117 137 156 175 195 176 156 136 117  97  78  58  39
  20]
estimated y = [ 30.54752243  49.21960251  67.89168259  86.56376267 105.23584275
 123.90792283 142.58000291 161.25208299 179.92416307 198.59624315
 164.98649901 146.08101792 127.17553684 108.27005576  89.36457468
  70.4590936   51.55361252  32.64813143  13.74265035]
Linearity error#
\(\epsilon_L = |y_L - y|\)
\(\epsilon_{L_{max}} = max(\epsilon_L)\)
\(r_0 = y_{max} - y_{min}\)
\(\% \epsilon_{L_{max}} = \frac{\epsilon_{L_{max}}}{r_0}\times 100\)
epsilon_L = abs(y - y_fit)
epsilon_L_max = max(epsilon_L)
r0 = max(y) - min(y)
percent_epsilon_L_max = epsilon_L_max/r0 * 100.
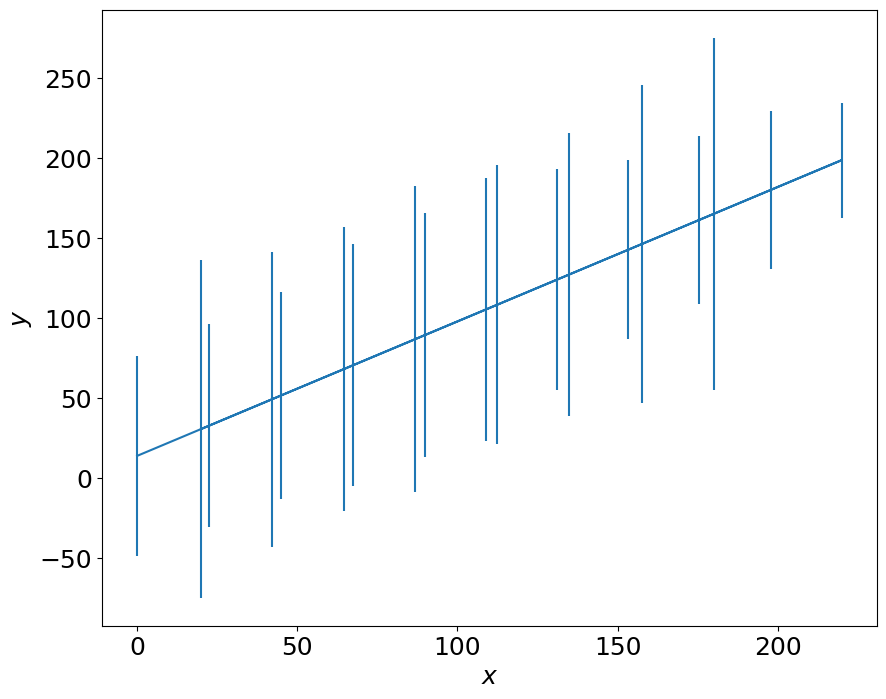
pl.errorbar(x,y_fit,10*epsilon_L)
pl.xlabel(r'$x$')
pl.ylabel(r'$y$')

print ('max error is %4.3f' % epsilon_L_max)
print ('the range is %4.3f' % r0)
print ('Linearity error is %3.2f%s' % (percent_epsilon_L_max,'%'))
max error is 11.014
the range is 175.000
Linearity error is 6.29%